 View Our Strategy Document 2019 – 2024
August 30, 2024

A More Accurate Picture of Where Soil Erosion Is Likely
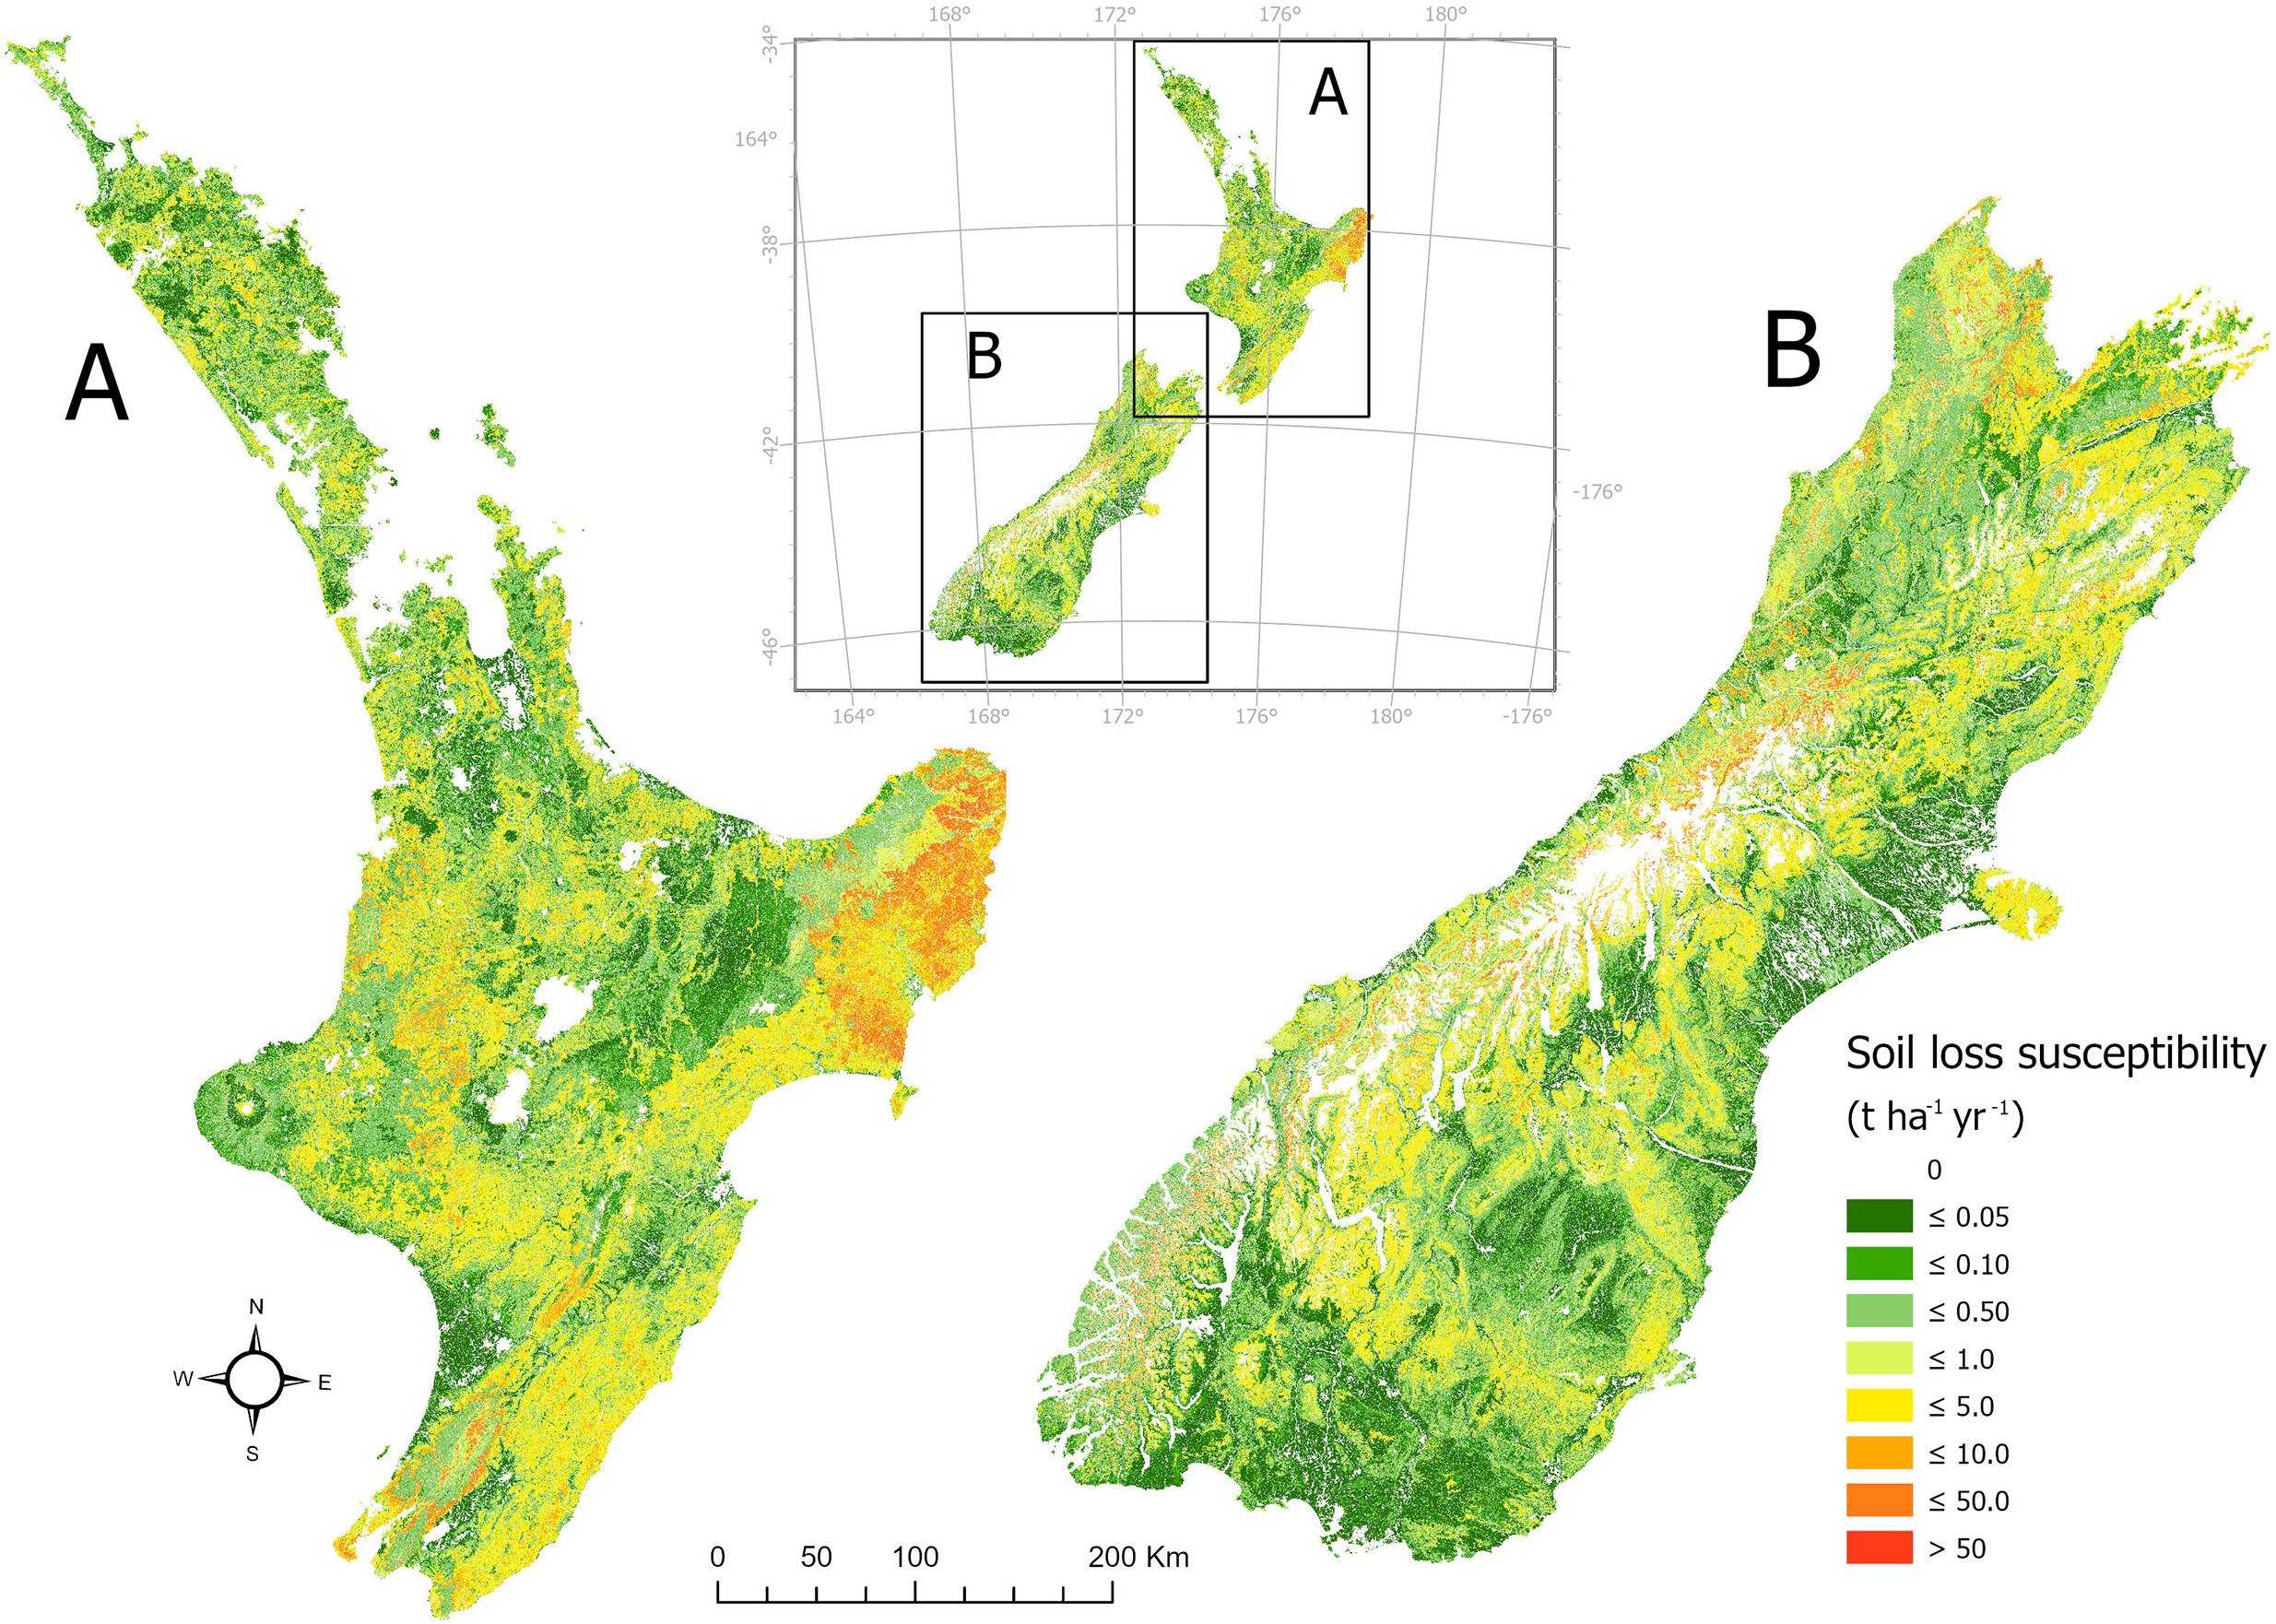
We developed the first national-scale map of surface erosion for New Zealand that can also be used at farm scale. The map is also the first in the world to include the impact of stock grazing, so provides a more accurate picture of surface erosion susceptibility.
Erosion of topsoil threatens food production, land stability, water quality and ecosystem functioning around the world. In New Zealand around 192 million tonnes of soil are lost to erosion each year.
Globally, soil erosion models play a critical role in understanding where and how to conserve soil, but until recently, the impact of livestock grazing has not been accounted for. For New Zealand, where 40 percent of land is in pasture, this meant we had an incomplete picture of surface erosion susceptibility.
A new high-resolution map, developed through Our Land and Water’s Land Use Suitability programme, incorporates grazing to provide a more complete and accurate picture of land’s susceptibility to soil loss from surface erosion at farm, catchment and national scales.
This is the first national-scale map of surface erosion for New Zealand that can also be used at farm scale, and the first in the world to include the impact of stock grazing on surface erosion.
| Regional maps are now available for download. |
A more realistic, detailed picture of surface erosion
Researchers produced the map by developing a sub-model, which they plugged into a globally recognised and used model for calculating land’s susceptibility to surface erosion, the RUSLE (Revised Universal Soil Loss Equation) model.
Initial results show that integrating the sub-model into the RUSLE model vastly improves estimates of soil loss from pastoral land, with modelled surface erosion strongly aligning with observed measurements.
The RUSLE model calculates soil erosion susceptibility using seasonal rainfall, slope length and steepness, soil erodibility and groundcover and management factors. When combined with the sub-model, it can incorporate the impacts of grazing and stock treading on soil’s physical properties and groundcover, and therefore on surface erosion.
The sub-model uses observed relationships between grazing/treading intensity (stock hoof pressure, grazing density, duration and history) and damage to soil physical properties (permeability and structure). It further accounts for susceptibility due to clay content and seasonal soil moisture, both of which alter soil’s susceptibility to pugging and compaction. It even incorporates natural variability in seasonal groundcover (think, vegetation growth and senescence) and monthly rainfall erosivity calculated from NIWA rainfall.
The Whitiwhiti Ora Land Use Opportunities project further updated the model to predict future surface erosion that could arise from changes in rainfall due to climate change.
Ever-improving accuracy
As more data becomes available, the models are being updated and improved to provide an even more accurate picture of surface erosion.
An initial version of the sub-model used a uniform stocking density, but this is being updated with spatially variable stocking densities, developed through a Ministry of Primary Industries Greenhouse Gas Industry Research funded project.
Work is also underway with the Our Land and Water Mapping Contaminants from Source to Sink programme to improve and update the part of the sub-model that deals with the transport and fate of eroded sediment.
This is the first national-scale map of surface erosion for New Zealand that can also be used at farm scale, and the first in the world to include the impact of stock grazing on surface erosion
From national to farm scale use
The map’s resolution of 15 metres per pixel makes it a valuable tool for a wide range of parties, including central government, regional councils, catchments groups and farmers.
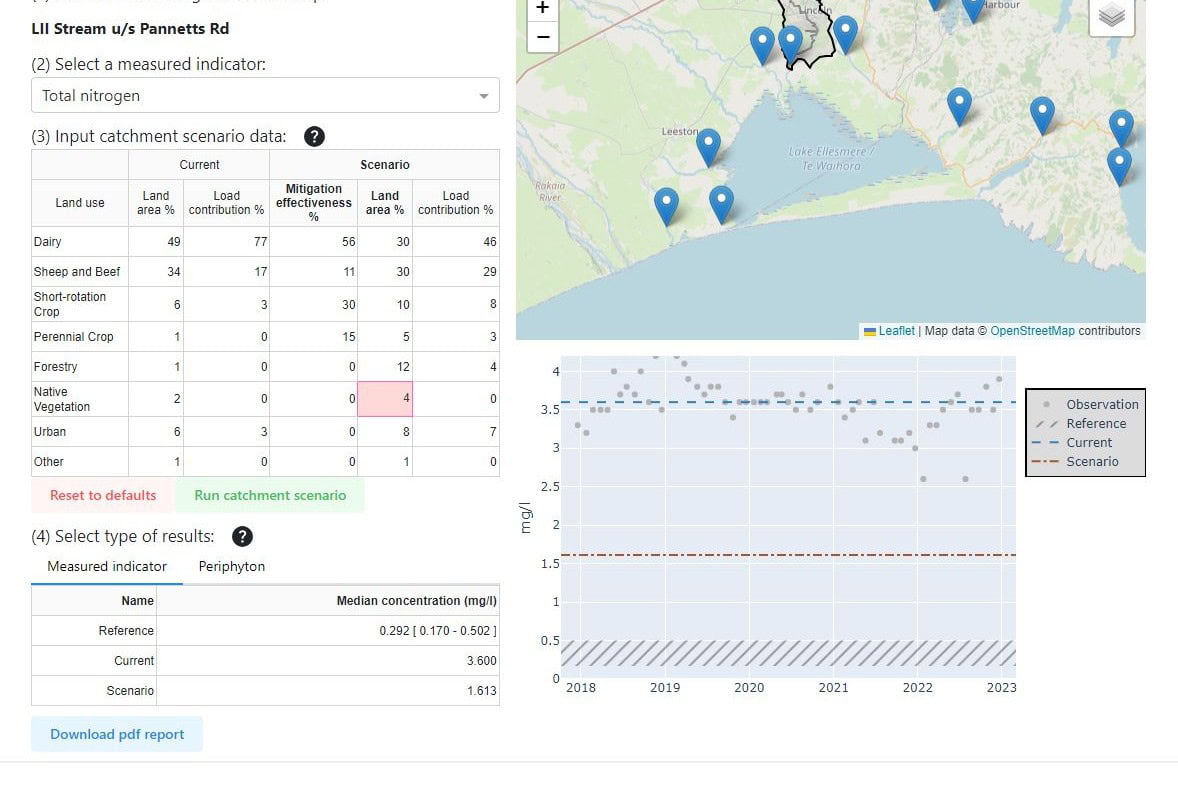
The map can provide estimates of surface erosion susceptibility from different land uses and areas of land. This is particularly useful for understanding the relative contribution of each land use at catchment scales.
By improving understanding of land that is susceptible to surface erosion, land that is unsuitable for intensive use can be identified.
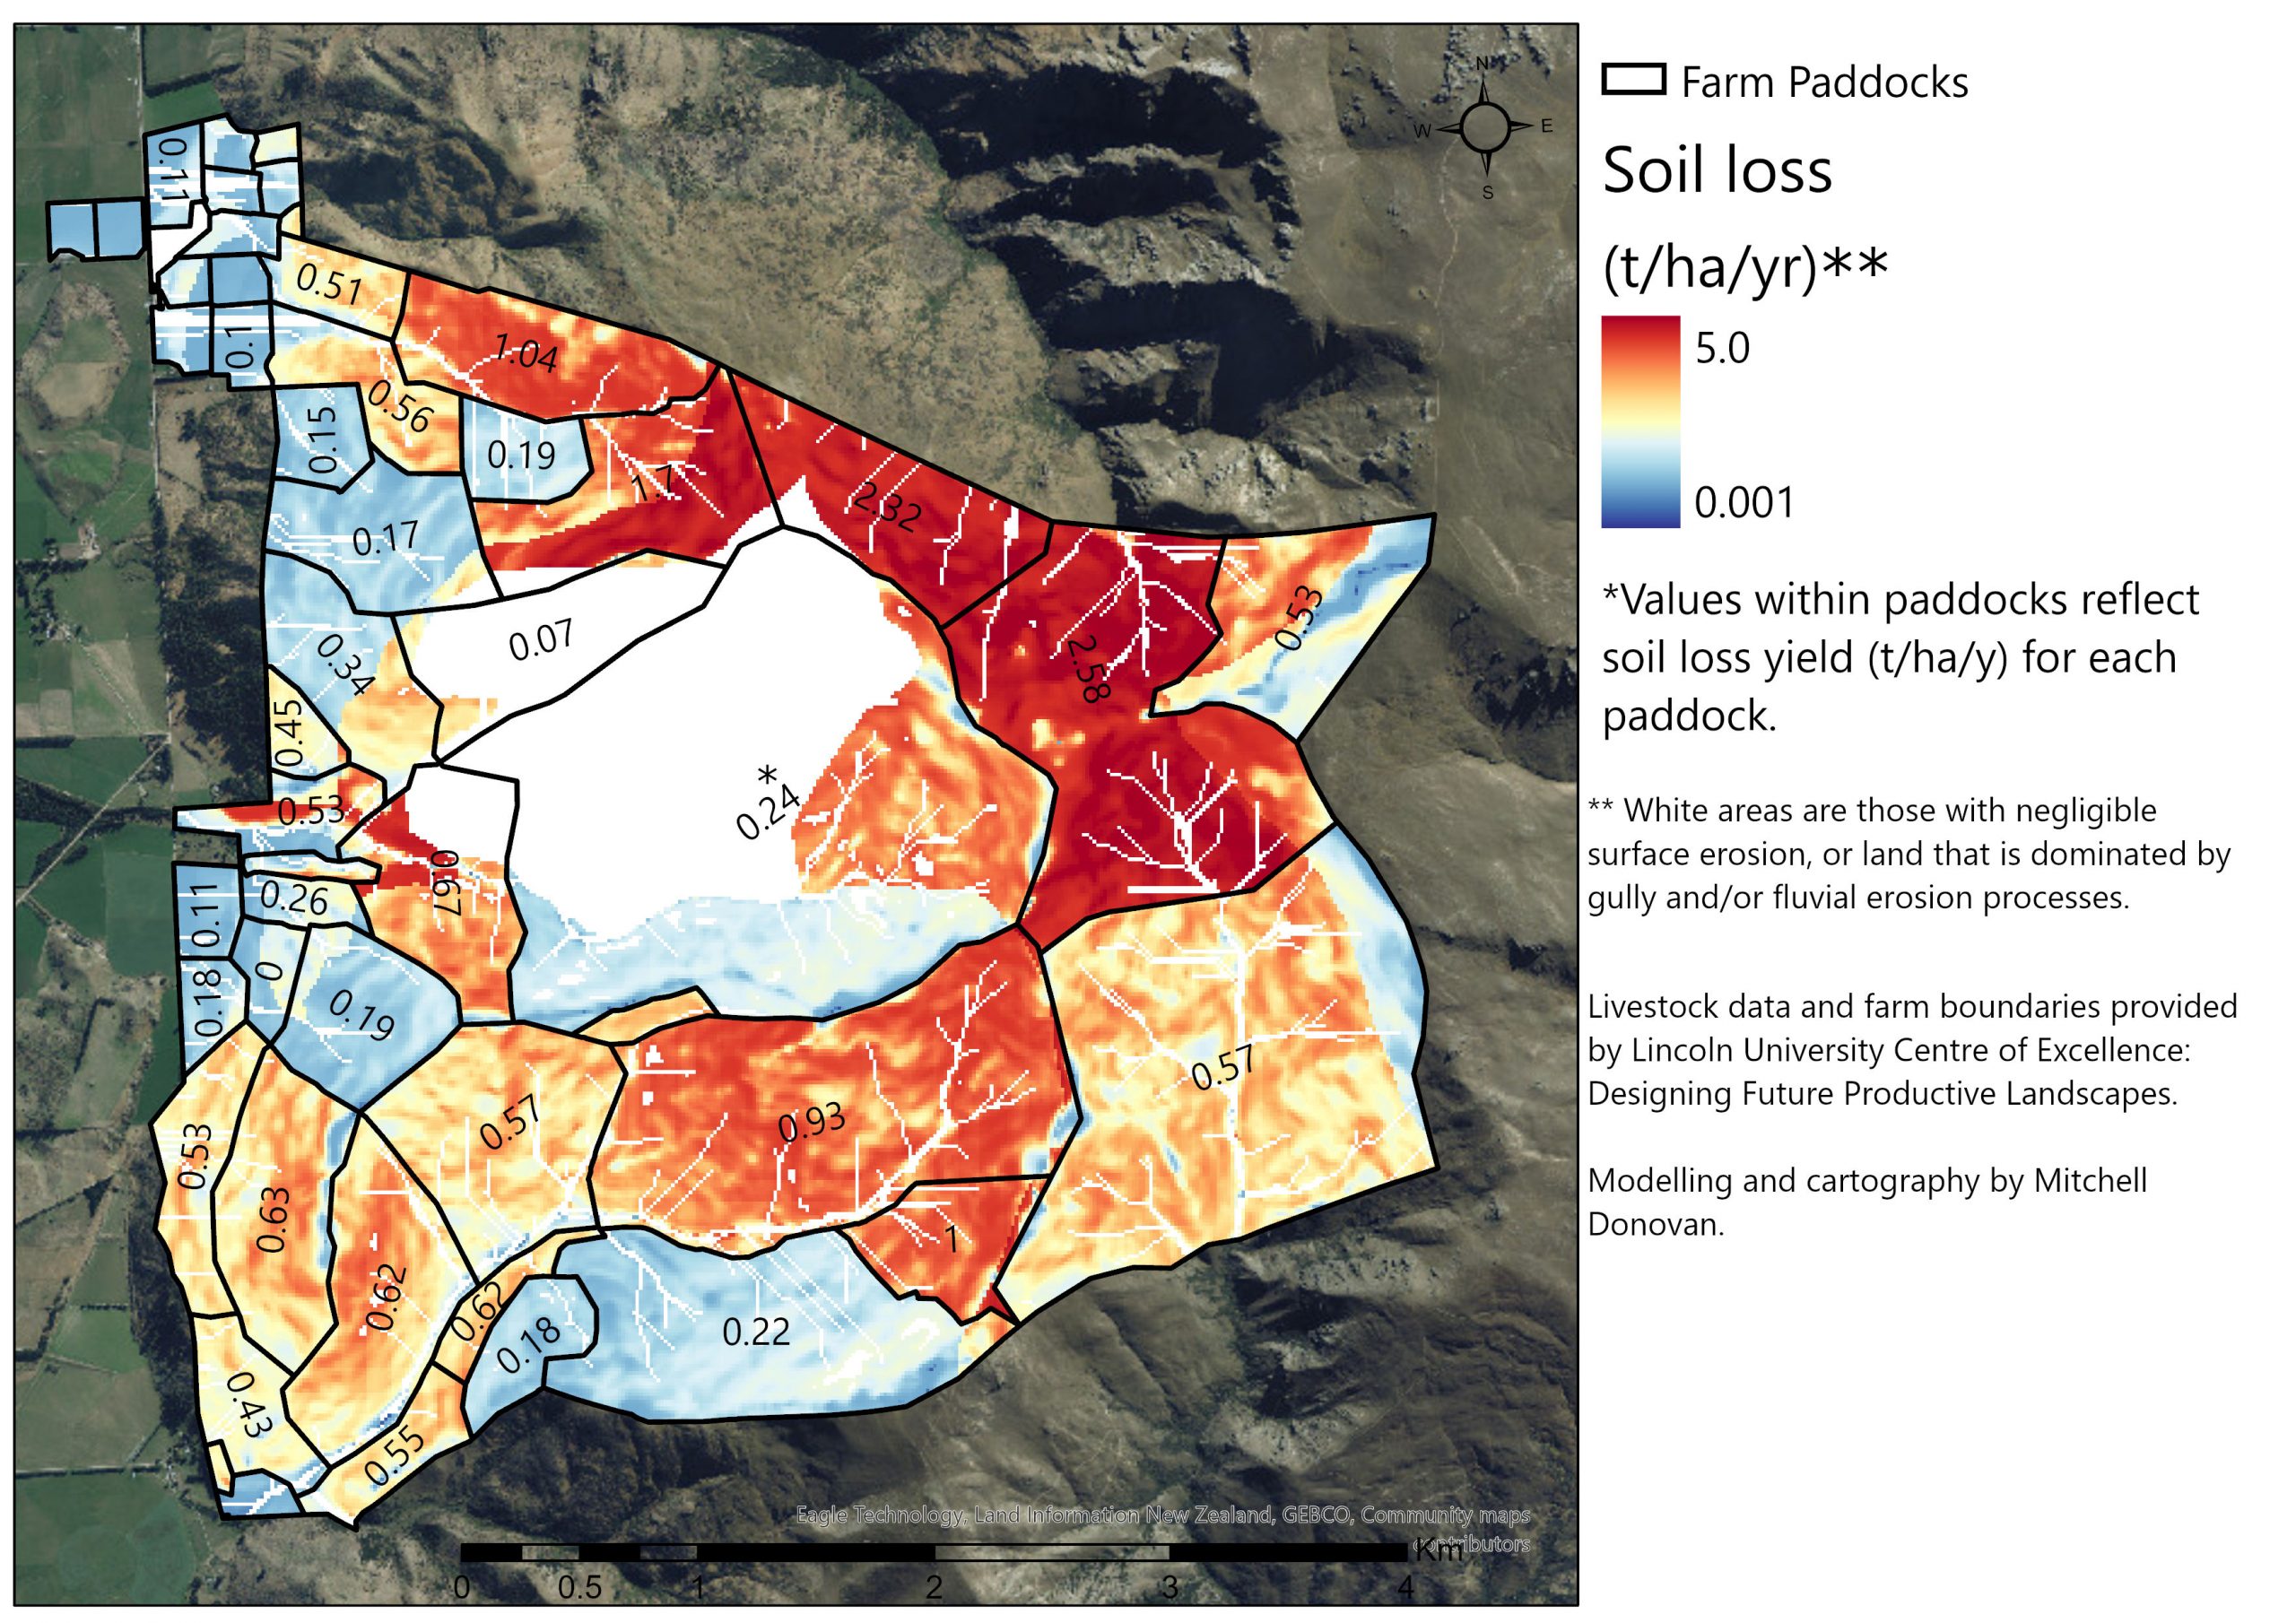
At a farm scale (see example above), the model can identify land areas and paddocks that are susceptible to soil loss and which should not be grazed intensively, so as to avoid losing natural capital. In this way, it is a proactive measure for reducing soil loss, rather than relying on reactive approaches and costly mitigations such as sediment traps and detention bunds.
This makes the map an effective tool to identify where winter forage crops are best located, which based on preliminary results from this research, lose 10 times more soil than pasture does.
In the future, the map may also inform Freshwater Farm Plans.
The maps and model outputs are being prepared to be publicly available.
Development of the national and catchment scale maps was funded by Our Land and Water.
More information:
- Modelling soil loss from surface erosion at high-resolution to better understand sources and drivers across land uses and catchments; a national-scale assessment of Aotearoa, New Zealand by Mitchell Donovan (Environmental Modelling & Software, January 2022)
- View more information on the research publications and contact details.
Author
48 responses to “A More Accurate Picture of Where Soil Erosion Is Likely”
Hi there
How can I get the layer in to our GIS system please?
Cheers
Bryan
Kia ora Bryan – your email address came through when OLW was notified of this comment through the website, so I will connect you to Mitchell via email 🙂
Kia ora,
could i get access to the GIS layerSure, I’ve passed on your request. Apologies for the late response!
Kia ora, regional maps are now available for download: https://figshare.com/s/1ad36056ebe7a21c5272
Hi there, can I please also have access to this GIS layer?
Thanks,
JamieKia ora Jamie, I’ve connected Bryan at your council with Mitchell (see other comment) – I will also connect you via email. Thank you!
Kia ora, regional maps are now available for download: https://figshare.com/s/1ad36056ebe7a21c5272
Hi there, can I also please also have access to this GIS layer?
Thanks,
LukeSure Luke, I’ll connect you to Mitchell via email.
Kia ora, regional maps are now available for download: https://figshare.com/s/1ad36056ebe7a21c5272
Our neighbours farm sends truckloads of topsoil into our water system.
May be your mapping might help in bringing some CHANGE.Hi there
As per other requests above, can we also get access to this GIS layer pleaseMany thanks
Sure Anna, I’ll connect you via email with Mitchell.
Kia ora, regional maps are now available for download: https://figshare.com/s/1ad36056ebe7a21c5272
Kia ora, could you please connect our Council team with this layer?
Thanks for your interest Hana, I’ll connect you via email with Mitchell.
Good morning,
Any chance we on the GIS Team at Taranaki Regional Council be connected with Mitchell to get access to this data set please?
thanks, hope you have a good day.Kia ora, regional maps are now available for download: https://figshare.com/s/1ad36056ebe7a21c5272
Hi there, can we please have access to this data as well?
Cheers,
JerramI’ve emailed you and Mithell to connect you 🙂
Kia ora, regional maps are now available for download: https://figshare.com/s/1ad36056ebe7a21c5272
Good morning,
Can I have access to this GIS layer please.
Sure, I’ve passed on your request. Apologies for the late response!
Kia ora, regional maps are now available for download: https://figshare.com/s/1ad36056ebe7a21c5272
Hi, Can I also get the GIS layer for this one? Thank you!
Sure, I’ve passed on your request.
Kia ora, regional maps are now available for download: https://figshare.com/s/1ad36056ebe7a21c5272
Kia ora,
can I have access to the GIS layer please?
KR
CaterinaSure, I’ve passed on your request.
Kia ora, regional maps are now available for download: https://figshare.com/s/1ad36056ebe7a21c5272
Can we please have access to the GIS layers too?
Sure, I’ve passed on your request.
Kia ora, regional maps are now available for download: https://figshare.com/s/1ad36056ebe7a21c5272
Could I have some more info on the case study and future application of work please?
Sure, I’ll see what we can find, I’ve passed on your request.
Can I please request access to this layer.
Thanks
FionaI’ve passed on your request to our chief scientist Rich and the lead researcher Mitchell 🙂
Kia ora, regional maps are now available for download: https://figshare.com/s/1ad36056ebe7a21c5272
Kia ora, like many others before me, I would also like access to this dataset in GIS format please. Can you please contact me about that. And is there any consideration being given to making it publicly available and accessible (e.g., on Koordinates)? Many thanks,
S.Kia ora, regional maps are now available for download: https://figshare.com/s/1ad36056ebe7a21c5272
Can I please have access to this layer?
Can I please get the GIS files for Taranaki region?
Kia ora, regional maps are now available for download: https://figshare.com/s/1ad36056ebe7a21c5272
Hi Annabel
I see many requests for the GIS data layer.
There is a need for ORC to engage with the GIS data set to enable us to use this for the Otago region as we are looking at erosion susceptibility at present.
Could you please also pass this request on also plus perhaps give an indication as to the success in being able to gain access to the data files?
Thanks
Mark
Kia ora, regional maps are now available for download: https://figshare.com/s/1ad36056ebe7a21c5272
Kia ora,
I’ve got the same request as everyone else on here – can I please have access to the GIS files?
Cheers,
Hannah
Kia ora Hannah – these have now been linked within the article above. They are available here: https://ourlandandwater.nz/outputs/soil-erosion-losses-and-contributions-from-underlying-sources-causes/
Leave a Reply to Annabel McAleer Cancel reply