 View Our Strategy Document 2019 – 2024
August 30, 2024

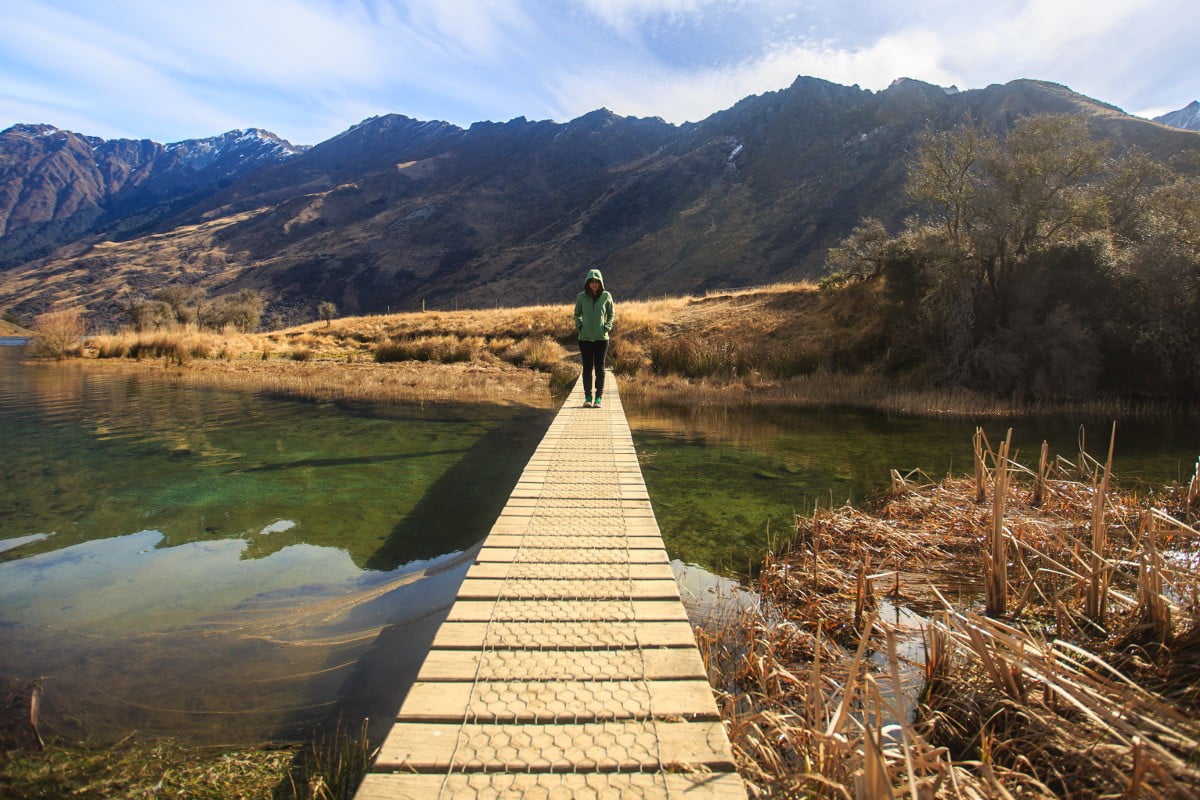
Phillip Capper, Flickr
Soil erosion losses and contributions from underlying sources/causes
October 2023

Regional maps of modelled soil loss from surface erosion across Aotearoa New Zealand are provided in .tif fomat for use in GIS.
These large .zip files (use 7-zip or PeaZip to extract) contain additional data for underlying causes such as climate, land use, etc.
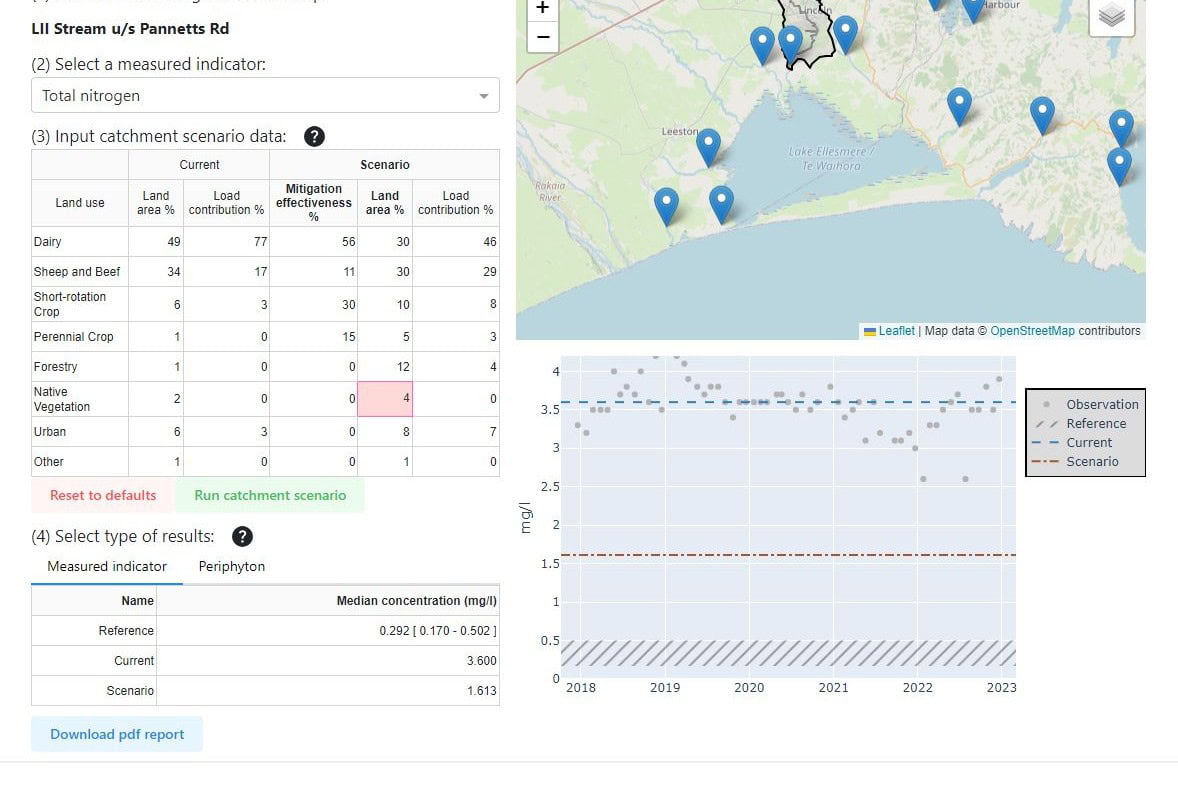
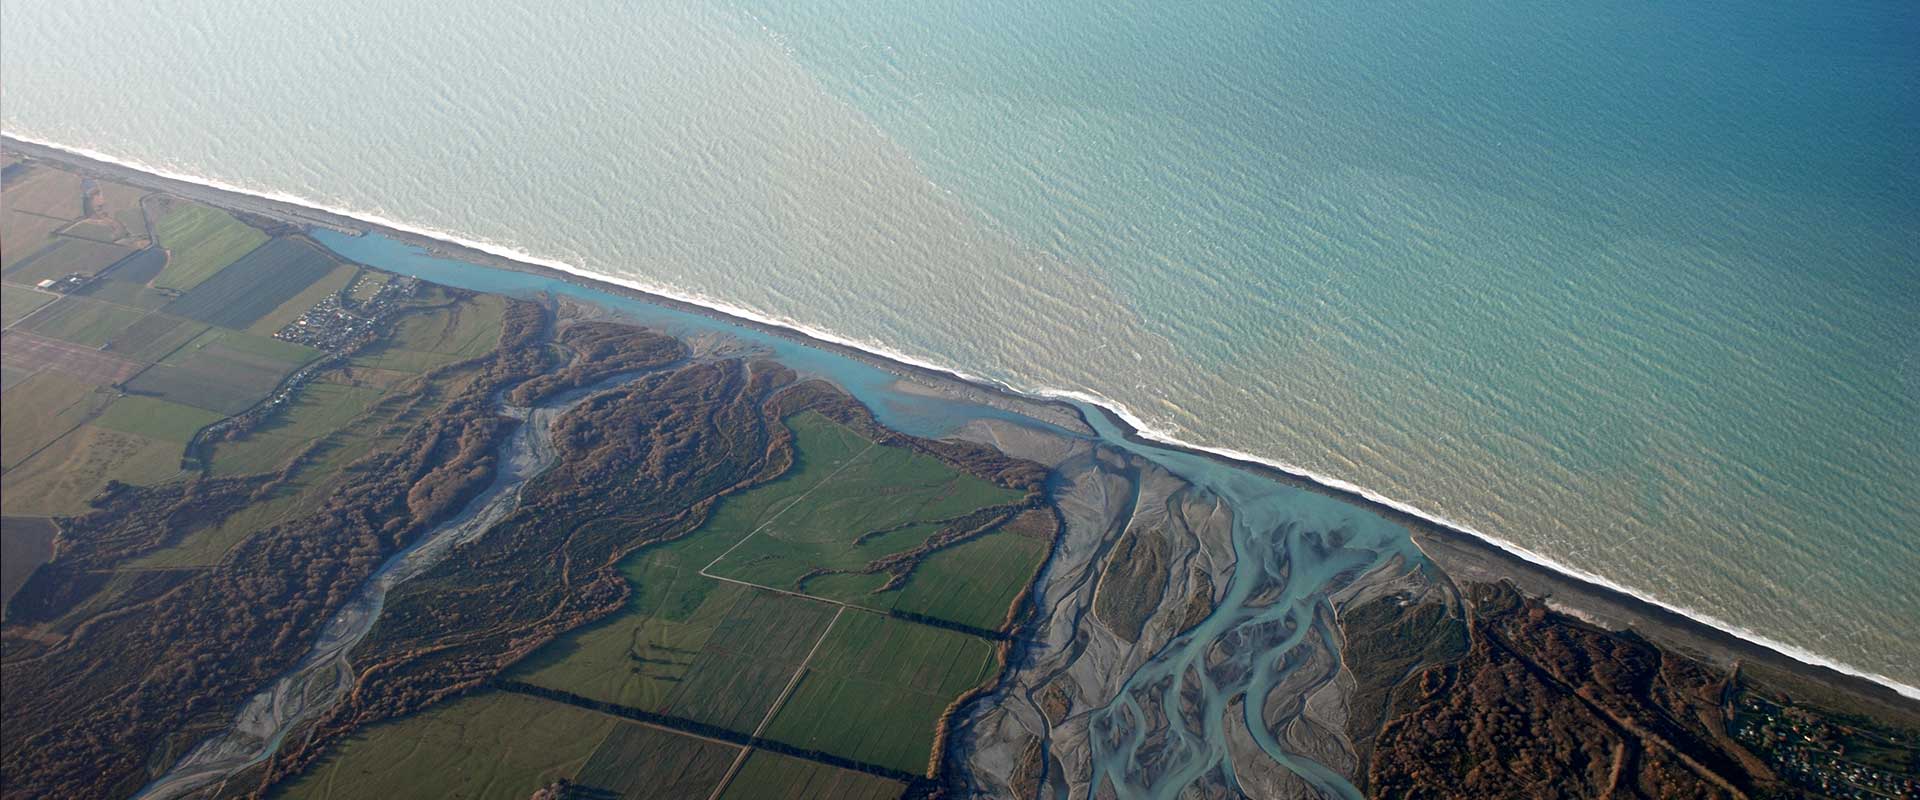
These maps are the first in the world to include the impact of stock grazing, so provide a more accurate picture of surface erosion susceptibility. The maps can provide estimates of surface erosion susceptibility from different land uses and areas of land. This is particularly useful for understanding the relative contribution of each land use at catchment scales.
By improving understanding of land that is susceptible to surface erosion, land that is unsuitable for intensive use can be identified.
Researchers produced the maps by developing a sub-model, which they plugged into a globally recognised and used model for calculating land’s susceptibility to surface erosion, the RUSLE (Revised Universal Soil Loss Equation) model.
Source: Donovan, M. (2022). Modelling soil loss from surface erosion at high-resolution to better understand sources and drivers across land uses and catchments; a national-scale assessment of Aotearoa, New Zealand. Environmental Modelling & Software 147: 105228. https://doi.org/10.1016/j.envsoft.2021.105228