 View Our Strategy Document 2019 – 2024
August 30, 2024
Nitrate Takes Less Than 5 Years to Travel from Farm to River, on Average
The decisions farmers make today to reduce excess nutrients will be reflected in water quality improvements in our rivers within five years, on average, finds new research on "lag times" from Our Land and Water.
The decisions farmers make today to reduce excess nutrients will be reflected in water quality improvements in our rivers within five years, on average, finds new research from Our Land and Water.
The research looked at the “lag time” between farm management decisions to reduce nitrogen loss, and the resulting improvement in river health.
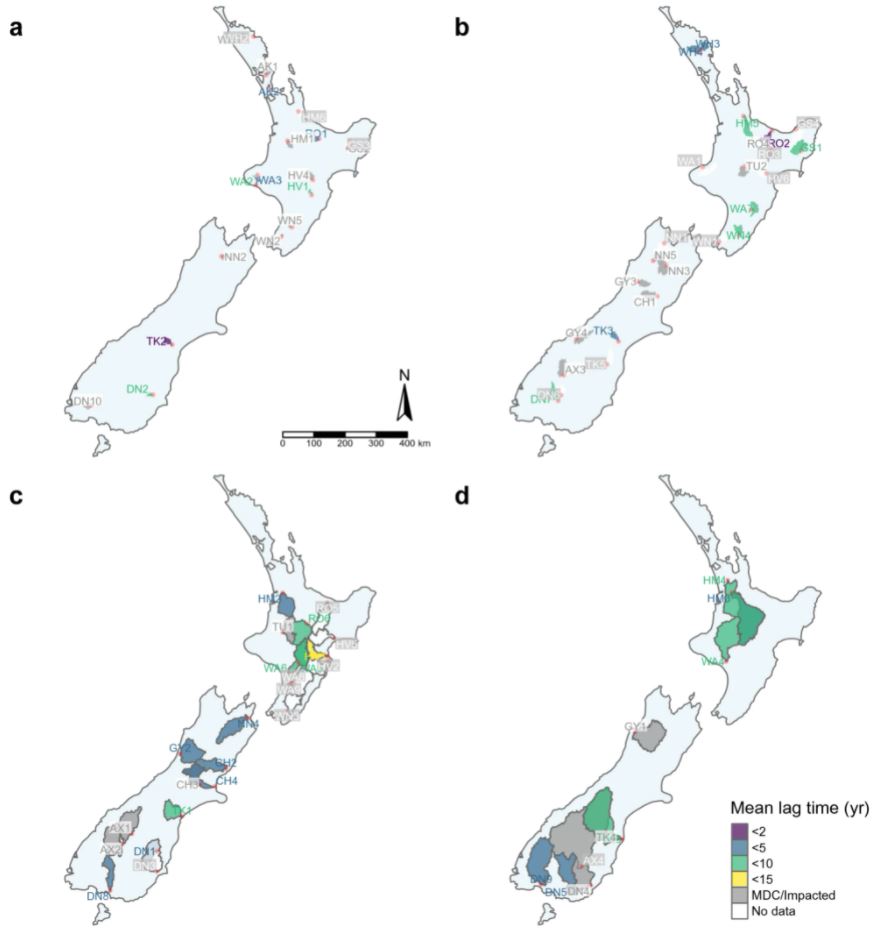
The average time for nitrate loads in rivers to reflect on-farm changes was 4.5 years, calculated using data for 77 catchments from 1990 to 2018. Lag times varied from one year to over 12 years, with water in larger rivers and more steeply sloped catchments taking longer to reflect upstream land management changes.
Farmers can be confident their responsible actions on land will eventually be reflected in our rivers, says Professor Richard McDowell, lead author of the paper and chief scientist at Our Land and Water, but we should expect nitrate loads in some catchments to reflect past farm inputs for some years.
“New Zealand’s ‘team of five million’ has become familiar with lag times due to the Covid-19 pandemic,” says Professor McDowell. “Just as we’ve seen Covid-19 case numbers rise in the first weeks of our level 4 lockdowns, before dropping, we may also see water quality in some of our rivers continue to decline for a while longer, despite strong and effective action being taken on farms.”
“If people who farm work as a team, hold their nerve, and continue to take strong action to improve our rivers, water quality will reflect these efforts within five years in many catchments,” says Professor McDowell.
“People in industry bodies, catchment groups, and farmer co-operatives can help by ensuring that people who are working to improve water quality have realistic expectations for the time frame in which we’ll see improvements, so they don’t get discouraged by lag times.”
“If people who farm work as a team, hold their nerve, and continue to take strong action to improve our rivers, water quality will reflect these efforts within five years in many catchments”
— Professor Richard McDowell, chief scientist, Our Land and Water
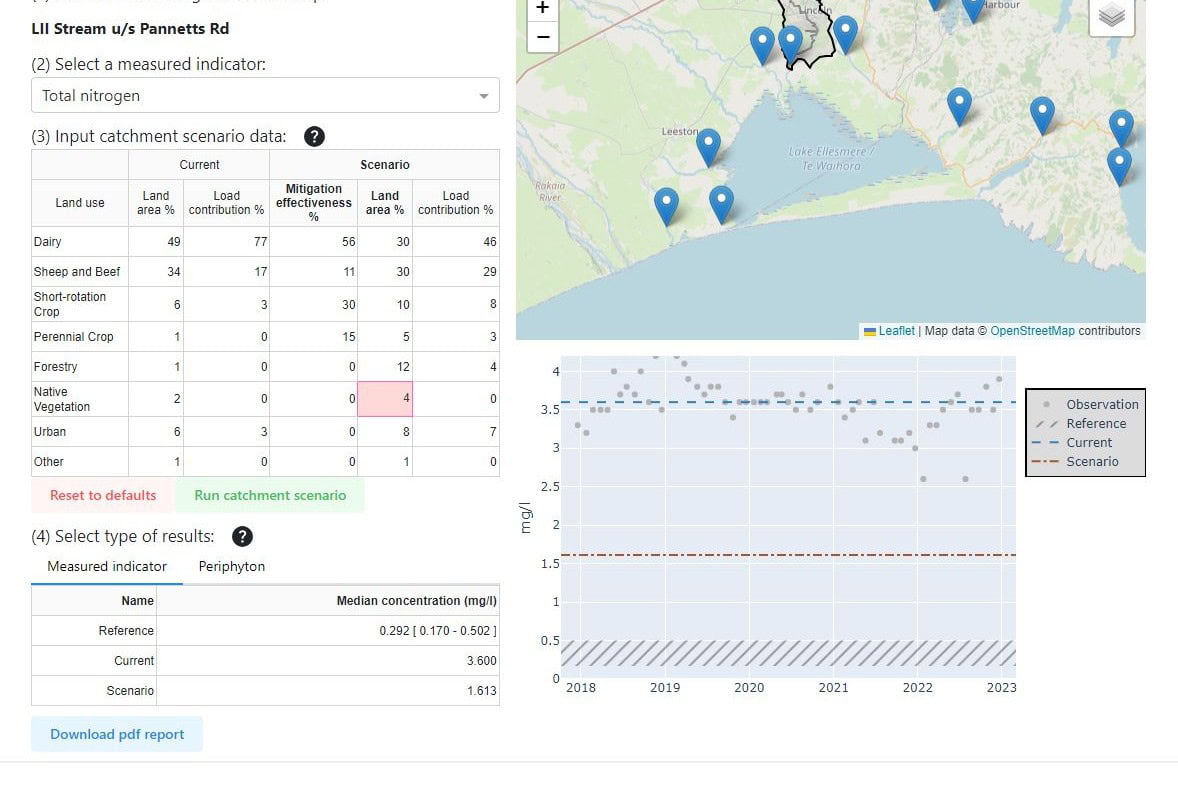
The research suggests that because small catchments and sub-catchments have shorter lag times, action by people in regional councils to expand and improve monitoring networks could enable earlier detection of improvement.
Improved monitoring by regional councils would provide people working to restore water quality with more immediate feedback about the effectiveness of their actions. This feedback can become part of a cycle where successes and failures are understood, increasingly effective plans are then developed, and this greater confidence leads to increased action on land. (See Guidance: Monitoring the Effectiveness of Actions to Improve Freshwater for more information.)
The research used data from the National River Water Quality Network, which covers about half of New Zealand. Lag times could be determined for 34 catchments, while the remaining catchments showed little change in nitrate load over the period.
While this research focussed on nitrate, which may see a larger proportion of its load transported through slow groundwater pathways, Professor McDowell points out that other contaminants that travel by surface pathways may reach rivers faster, meaning they may have a shorter lag time. Research is ongoing to see if this is the case.
In 2020, the New Zealand government introduced regulations that aim to improve the quality of New Zealand’s fresh water within five years and restore freshwater ecosystems to a healthy state within a generation.
This research was published in the Nature journal Scientific Reports in August 2021 and funded by the Our Land and Water National Science Challenge and MBIE.
More information:
- McDowell, R.W., Simpson, Z.P., Ausseil, A.G. et al. The implications of lag times between nitrate leaching losses and riverine loads for water quality policy. Sci Rep 11, 16450 (2021).
- Our Land and Water (2021). Monitoring the Effectiveness of Actions to Improve Freshwater. Guidance prepared by Our Land and Water (Toitū te Whenua, Toiora te Wai) National Science Challenge, New Zealand.
Author

Leave a Reply