 View Our Strategy Document 2019 – 2024
August 30, 2024

Study Reveals the Size of the Job to Achieve Water Quality Goals
The first assessment of where ‘bottom lines’ for all four freshwater contaminants are exceeded across Aotearoa contributes new knowledge about the scale of the challenge to achieve our freshwater objectives.
It will be extremely challenging to achieve New Zealand’s water quality goals, according to new research.
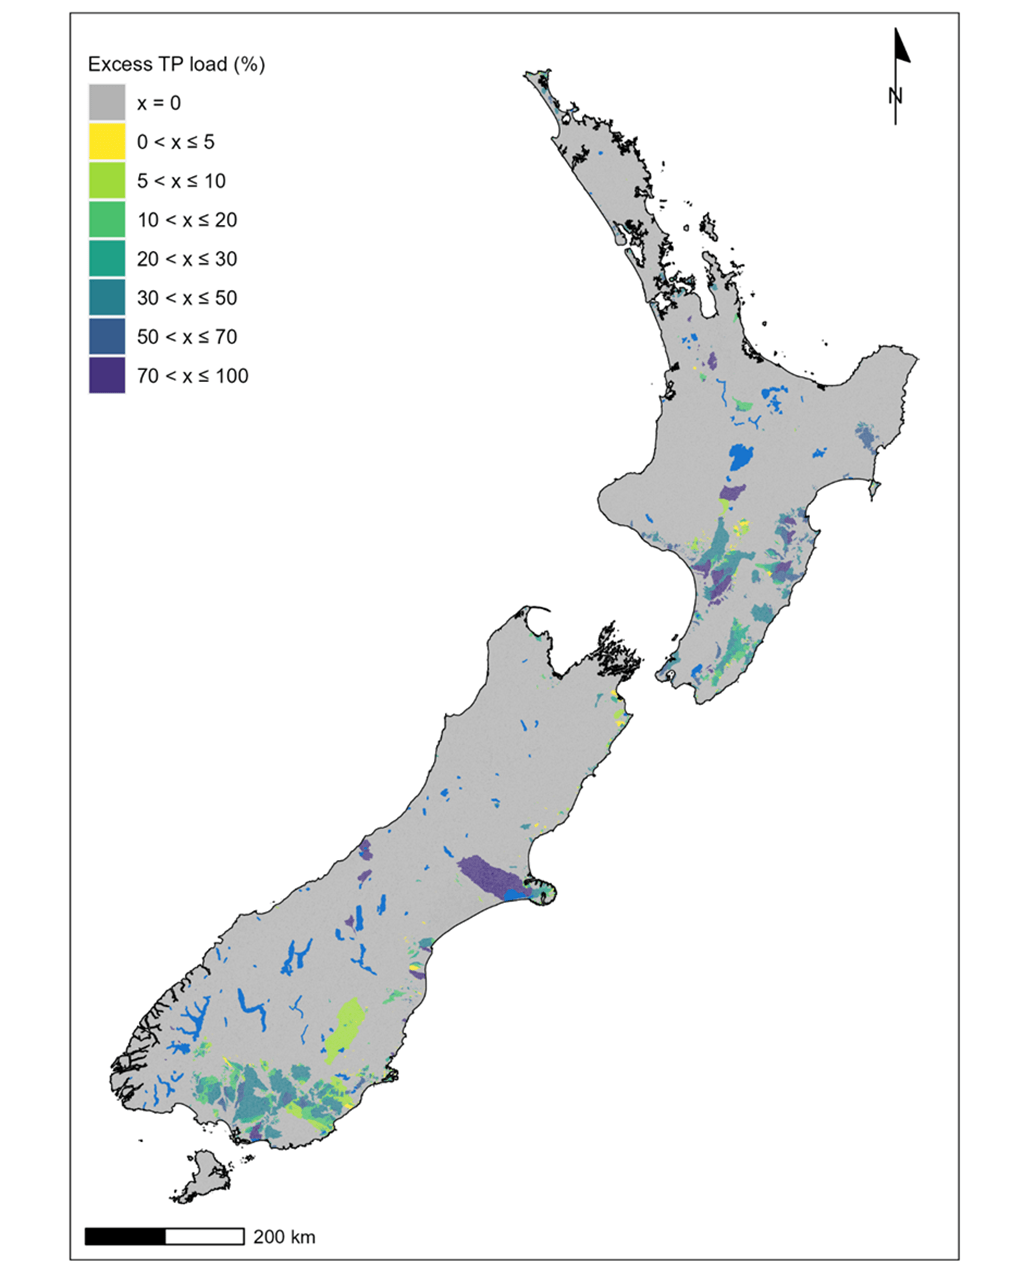
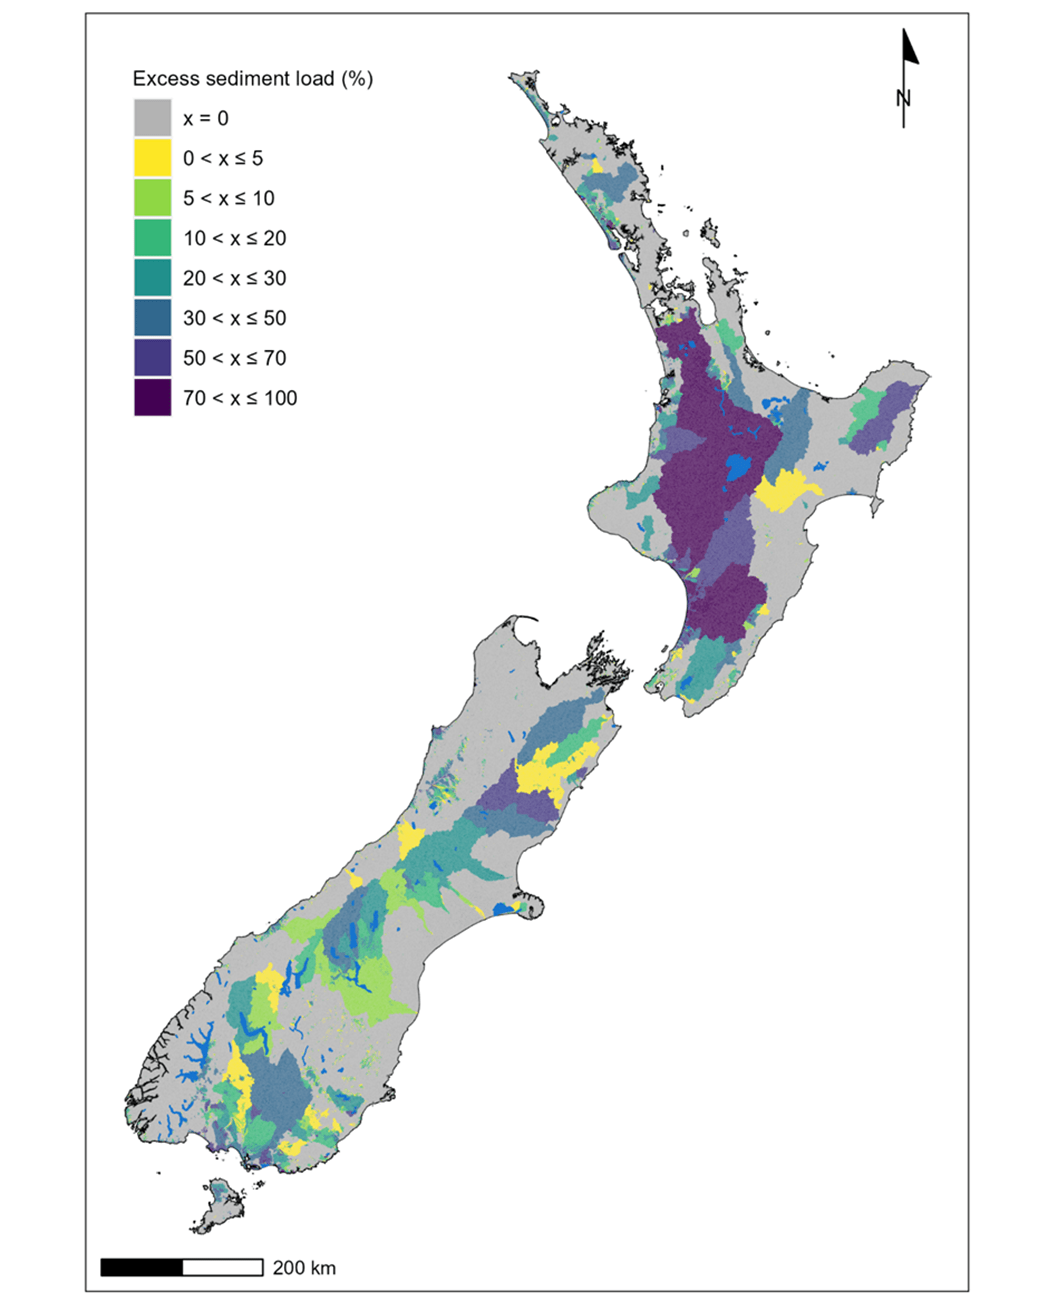
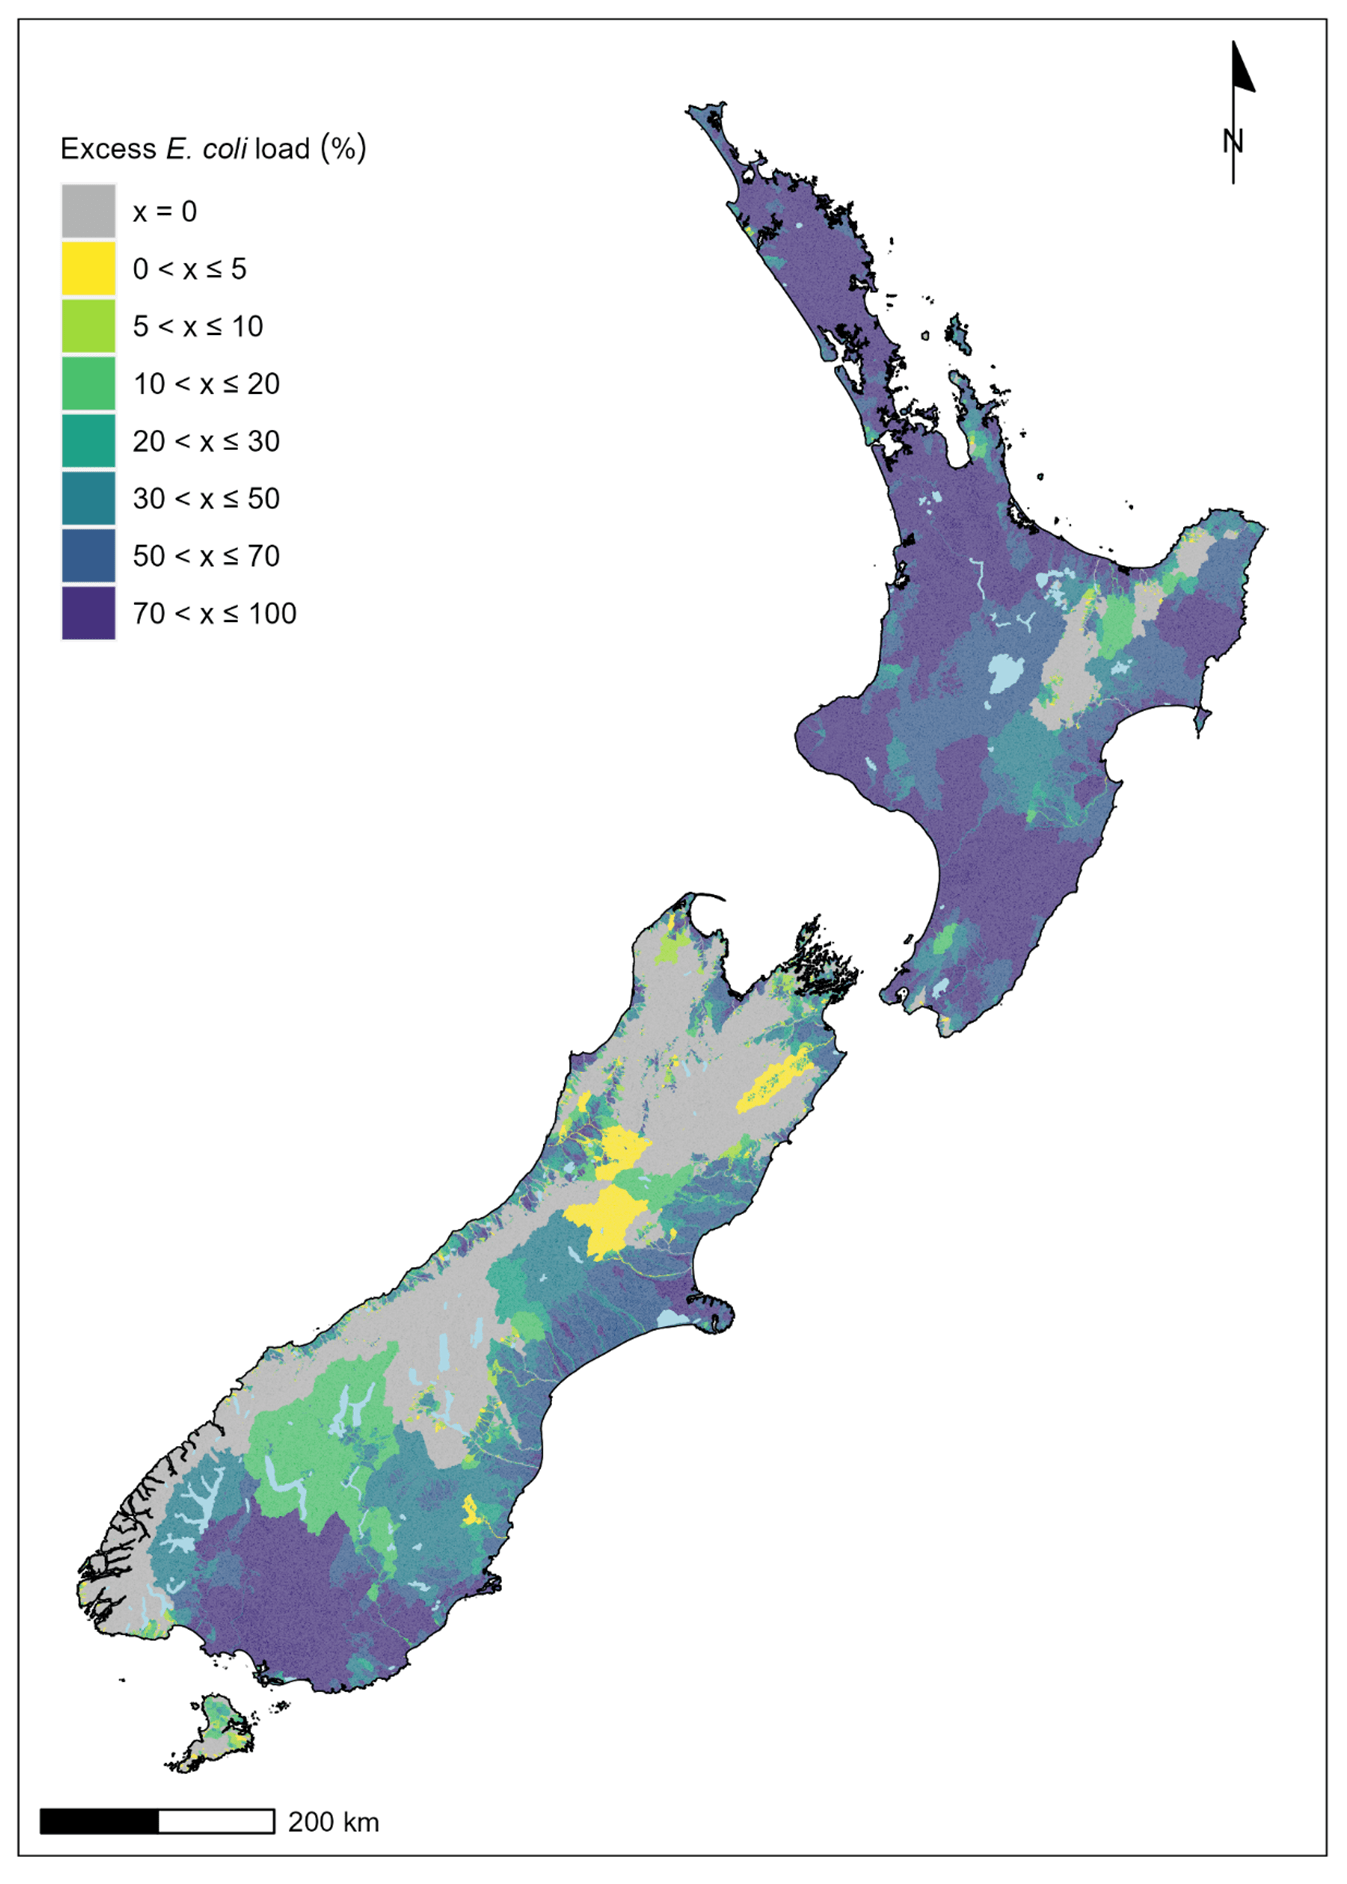
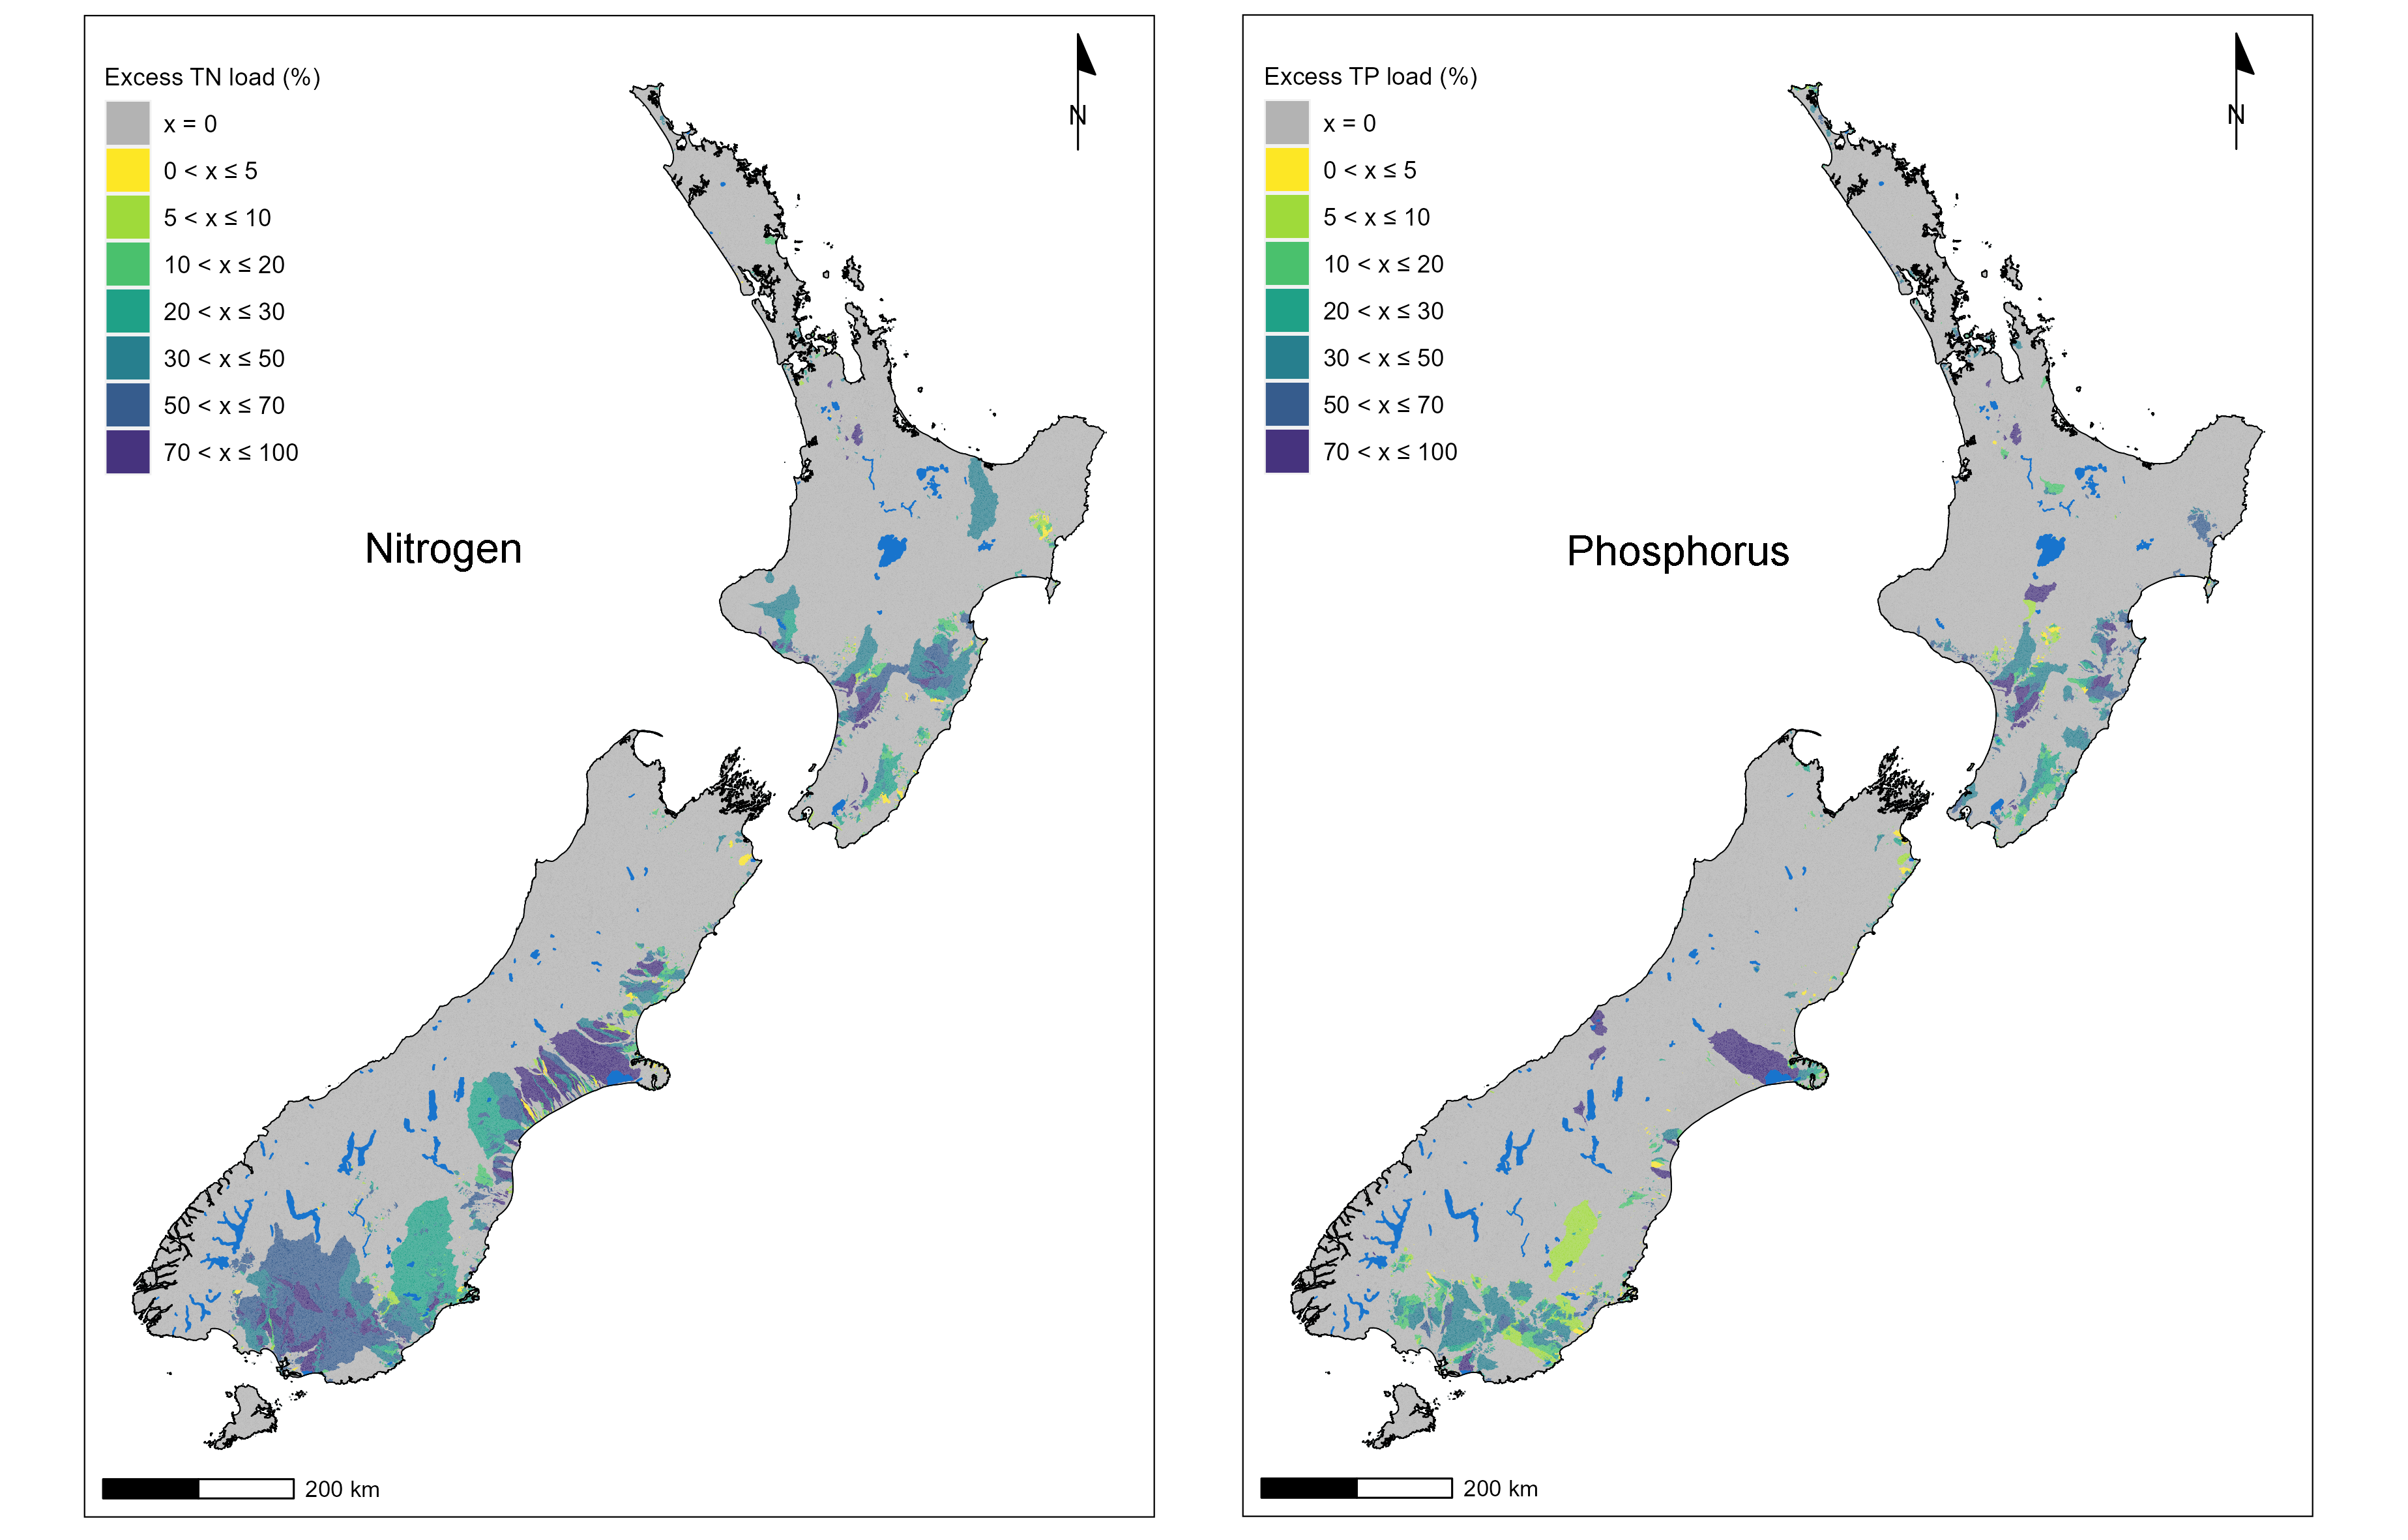
A new report evaluates the current state of four contaminants (nitrogen, phosphorus, Escherichia coli, and sediment) in rivers, lakes, and estuaries across Aotearoa New Zealand.
This is the first assessment of the ‘bottom lines’ for all four contaminants across the whole country, and reveals the approximate size of the job required to achieve the minimum requirements set in our regulations.
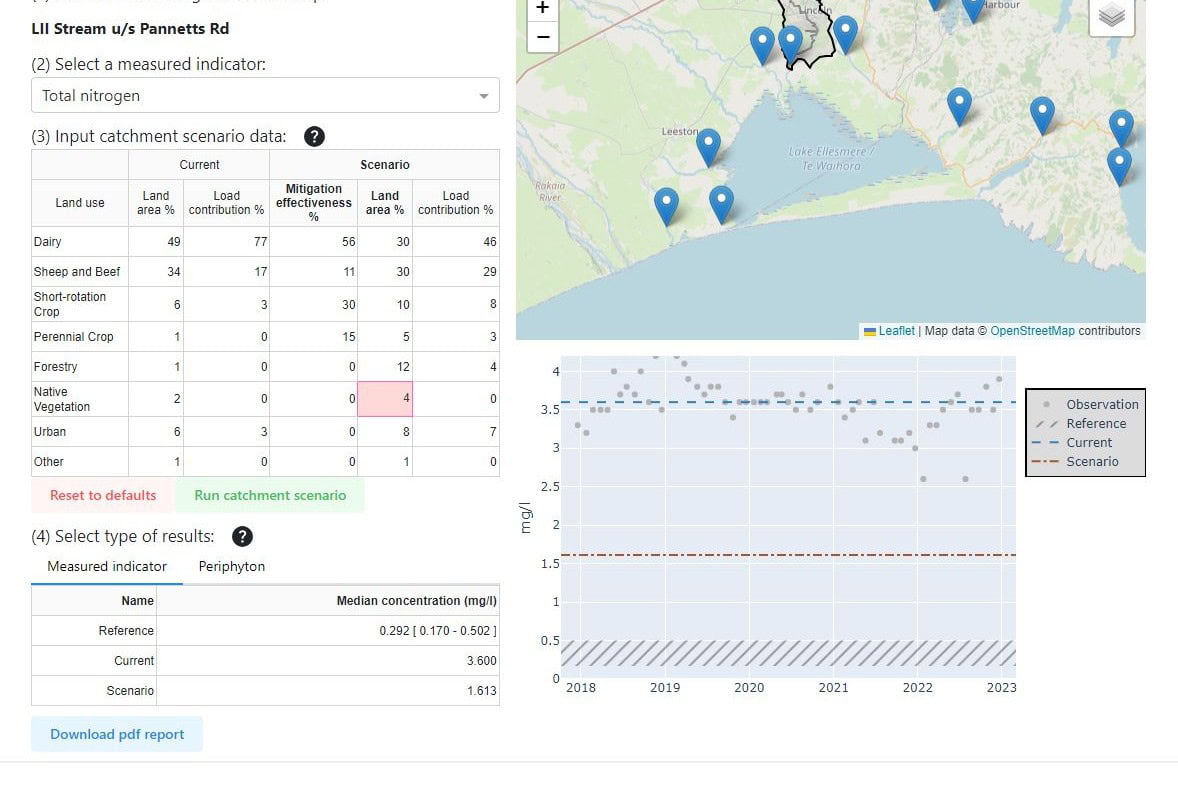
Achieving the contaminant reductions required by the national regulations will be extremely challenging, say researchers, particularly in catchments where the dominant source of all four contaminants is land that is under pastoral farming.
Substantial reductions of at least one contaminant are required in almost all regions. Many rivers, lakes and estuaries exceed the bottom line for more than one contaminant. This adds to the challenge, because actions to reduce one contaminant may not reduce another, so more effort, time and investment will be required to reduce multiple contaminants.
The research, funded by Our Land and Water, assessed the reduction in contaminant loads required to achieve New Zealand’s national bottom lines, a set of minimum acceptable states for our freshwater specified in the National Policy Statement for Freshwater Management 2020 (NPS-FM). (The current attributes for nitrogen and phosphorus were defined in the 2014 version of the NPS-FM, for E. coli in the 2017 NPS-FM, and for sediment and nitrate toxicity in the NPS-FM 2020.)
Three-quarters of all land in Aotearoa is contributing more E. coli to our water than is allowed – a much greater area than for the other three contaminants.
This research does not challenge the regulatory bottom lines defined by the NPS-FM. “Moving towards these bottom lines is currently the best option we have for improving ecosystem health and swimmability in rivers, lakes and estuaries with poor water quality,” says Dr Jenny Webster-Brown, director of Our Land and Water. “However, the report contains important new knowledge about the scale of the challenge.”
The research has generated maps that depict catchments according to the size of the load reductions required. This indicates where the greatest effort is needed to reduce water contamination to meet the national bottom lines.
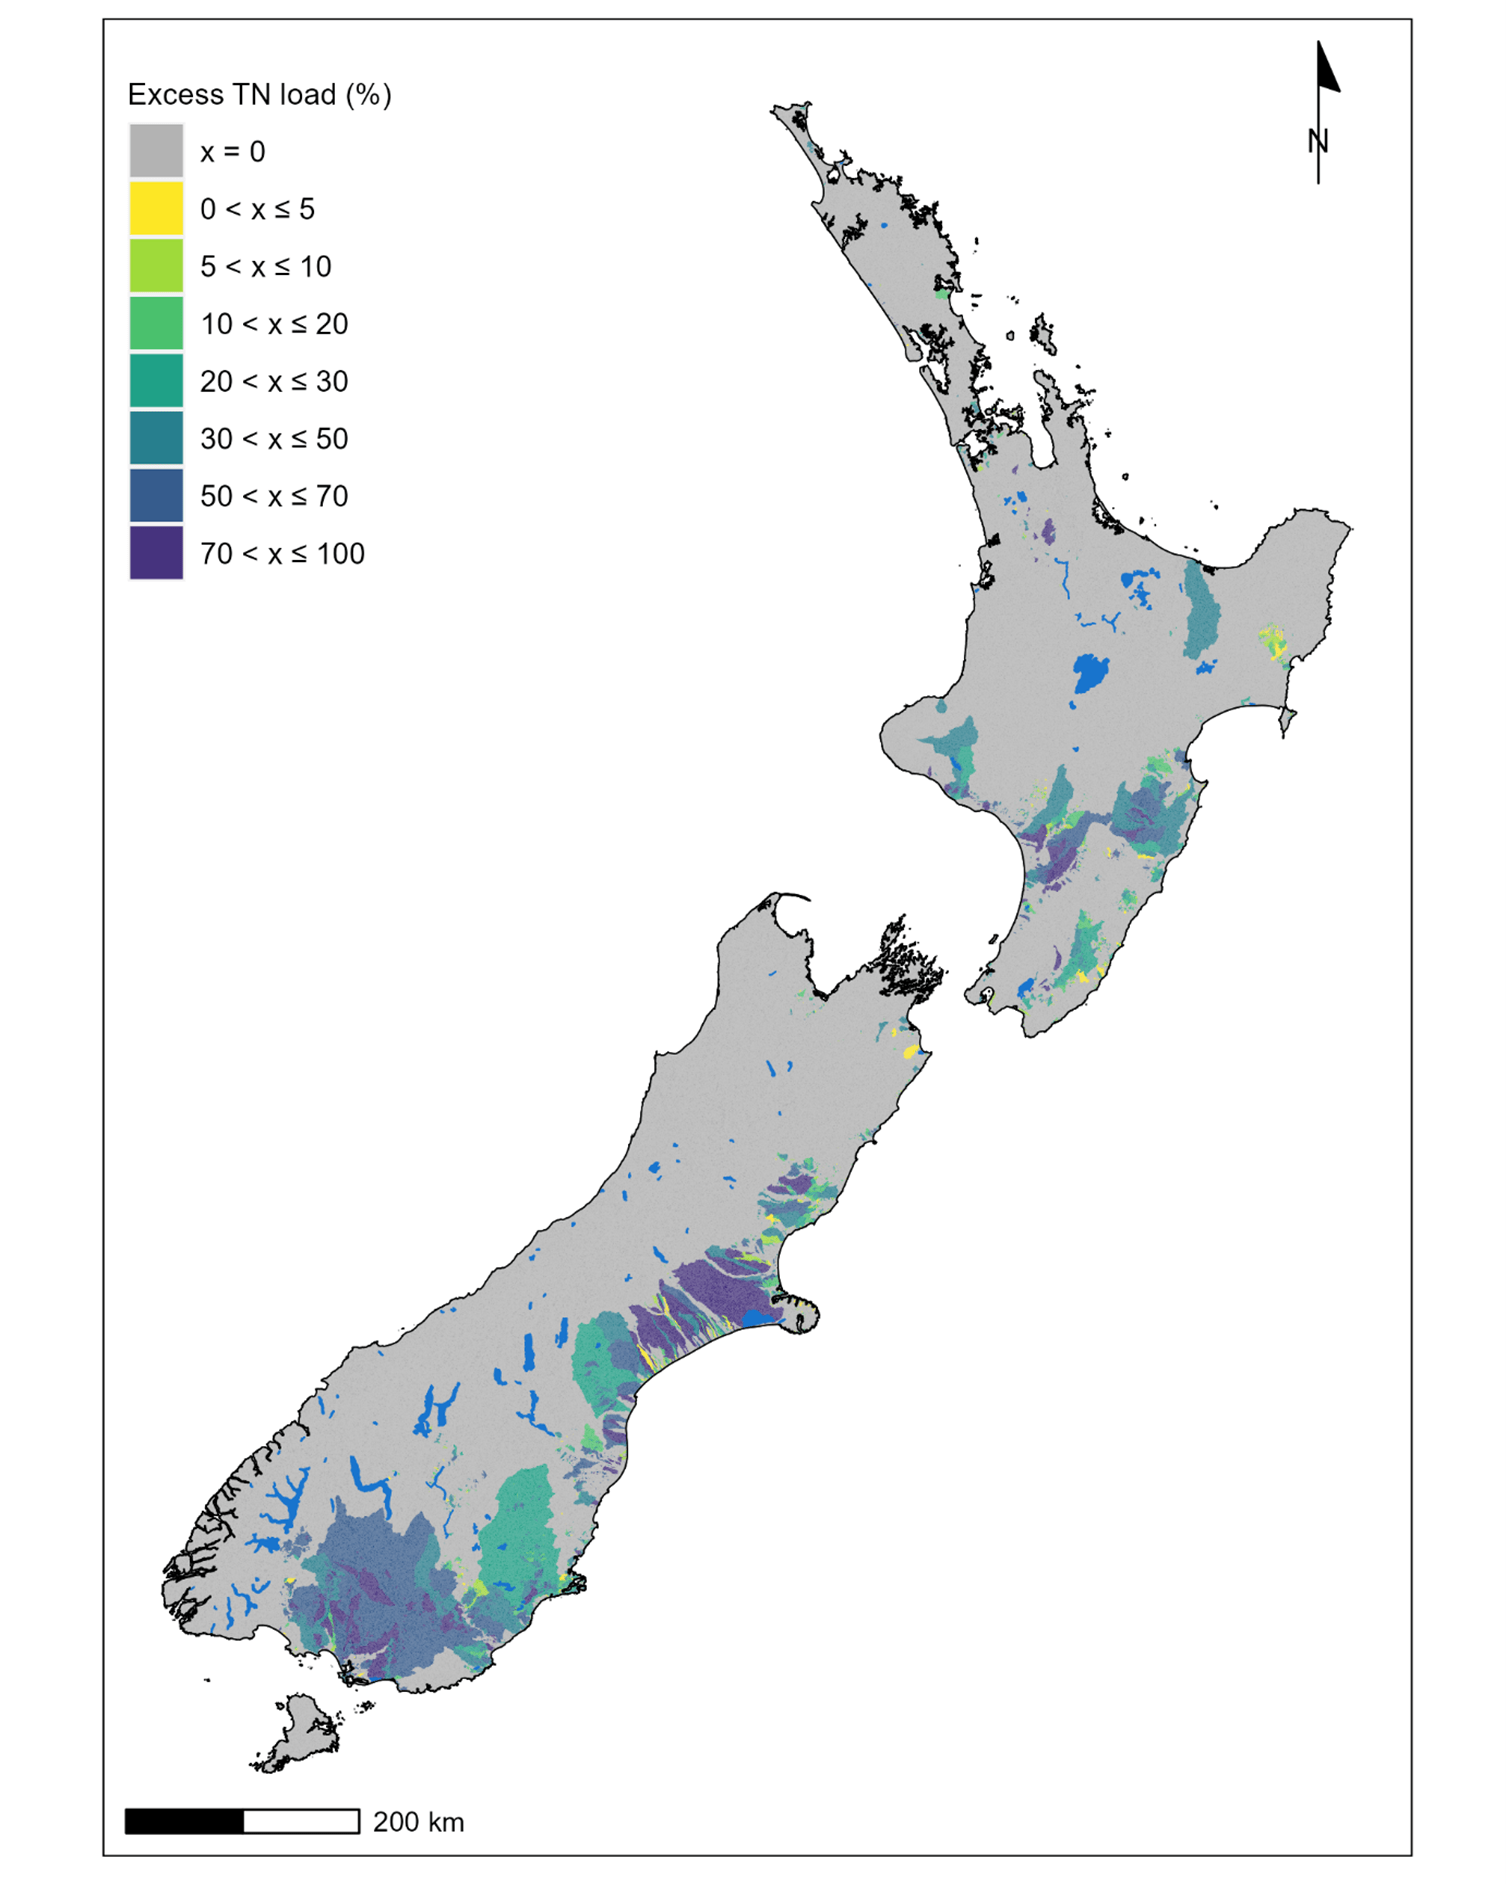
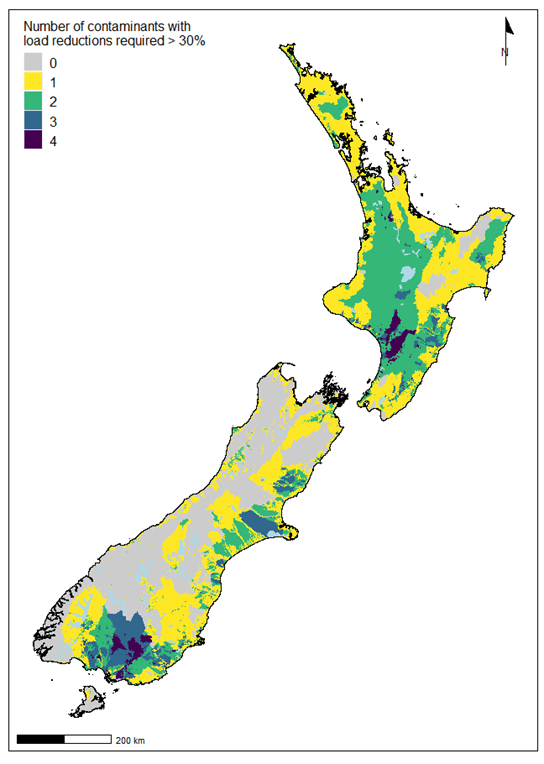
This information is critical to helping government and regional councils understand where community expectations for water quality can be met through improvements in farm practice, and where current land uses or intensity may be unsuitable. It can also help farmers in degraded catchments decide whether to continue investing in mitigation actions or consider making changes to land use or land-use intensity.
Policymakers in government and regional councils can use this study to guide the implementation of freshwater regulation, helping ‘size up’ the job ahead and set realistic expectations for the time, support and investment required to restore health to our rivers, lakes and estuaries.
The analysis used digital representation of New Zealand’s 650,000 river segments, 771 lakes and 419 estuaries and their catchment area. The research used models informed by data collected at 850 long-term water quality monitoring sites.
There are several sources of uncertainty in this analysis, outlined in the report. “This confirms that decisions by policymakers will ultimately need to be made despite such uncertainty,” says research lead Dr Ton Snelder, director of LWP. The study authors confirm they are 95% confident that load reductions are required for most contaminants in most regions, to achieve the minimum acceptable states for our freshwater.
More information:
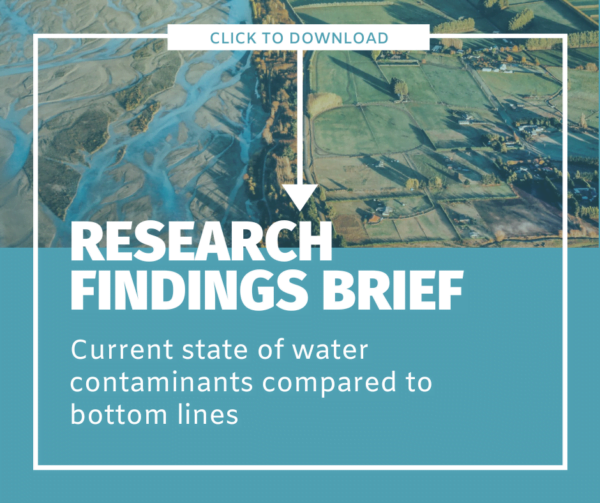
- Research Findings Brief: Current state of water contaminants compared to bottom lines, Our Land and Water (Toitū te Whenua, Toiora te Wai) National Science Challenge 2023. Text in this work is licensed under the Creative Commons Attribution 4.0 International License
- Nitrogen, phosphorus, sediment and Escherichia coli in New Zealand’s aquatic receiving environments: Comparison of current state to national bottom lines. Ton Snelder, Hugh Smith, David Plew, Caroline Fraser. LWP Client Report 2023-06, November 2023
- Map shapefiles and technical information are available in the Data Supermarket
- This research was completed as part of the Land Use Opportunities: Whitiwhiti Ora programme
Author
4 responses to “Study Reveals the Size of the Job to Achieve Water Quality Goals”
Hi there
The images on this site are different to the ones here for N excess here:
The lakes seem to be missing from the images on this site, but are present on the map in the link above. E.g. Lake Waikare. The lakes are also missing from the shapefile I downloaded. Is there a reason for this or is it an error?
Kia ora Mathew. Apologies – and thank you for identifying a mistake in version control of the preview image due to a last-minute update! I’ll forward you an updated image and we’re also making the update on the Data Supermarket. Re the lakes, in review it was found that some lakes were badly represented by the model because of the limited resolution of the model at the scale of analysis. The solution had to be to remove those lakes from the study. This meant the study went from representing 961 lakes to 771 lakes.
What does the acronym “LWP” stand for in the article, Study Reveals the Size of the Job to Achieve Water Quality Goals I cannot find it anywhere through the article.
“There are several sources of uncertainty in this analysis, outlined in the report. “This confirms that decisions by policymakers will ultimately need to be made despite such uncertainty,” says research lead Dr Ton Snelder, director of LWP. ”There have been several articles from various research’s that show the benefit of longer grazing rotations particularly developing deeper root structures and subsequent increased organic matter under pastoral farming. It is not a difficult way to achieve significant improvement together with other methods which add up to total management of pasture.
Kia ora Ray, LWP stands for Land Water People Ltd which is the name of the company that research lead Ton Snelder is based at.
Leave a Reply