 View Our Strategy Document 2019 – 2024
August 30, 2024
Scheduling Irrigation Using Satellite Data
Remote sensing has potential in calculating crop coefficients to enable accurate irrigation decision-making, but more research is needed.
Irrigation management consultant Cindy Lowe dreams of the day she will not have to install soil moisture sensors for clients, but instead advise them when to irrigate by using crop coefficients derived from satellite imagery. “I think we’re very close to that. It will come, it’s just getting that data that’s the sticking point,” she says.
While the science of calculating crop coefficients using remote sensing has been around since the 1970s, a robust commercial product is not yet available. This is partly due to the lack of available high-resolution satellite imagery.
Water Strategies led an Our Land and Water Rural Professionals Fund project to assess the viability of using the data collected by satellite, together with suitable software to interpret that data, to give irrigation scheduling recommendations.
But while the trial showed promise, patchy satellite coverage of New Zealand, combined with too many cloudy days when a suitable satellite was overhead, made it difficult to provide accurate irrigation scheduling decisions based purely on satellite imagery for the entirety of the growing season.
“The technology is there but the frequency is not, that’s the problem,” says Cindy. “If we had good, reliable daily data we could make it work.”
In the latter stages of the trial, more frequent satellite passes became available. These provided better, more timely, data but there is still more work to do to create a commercially viable model for New Zealand.
One practical output was achieved from the project – a method of calculating crop coefficients for any crop based on crop growth stages. Cindy says, “We have the capability to calculate crop coefficients for any crop based on the methodology we worked through with Plant & Food Research, not just milling wheat and table potatoes.”
Two problems
Soil water management can make a huge difference to the profitability and sustainability of a farm. Applying the correct amount of water at the right time is one of the most challenging issues facing growers, especially arable growers.
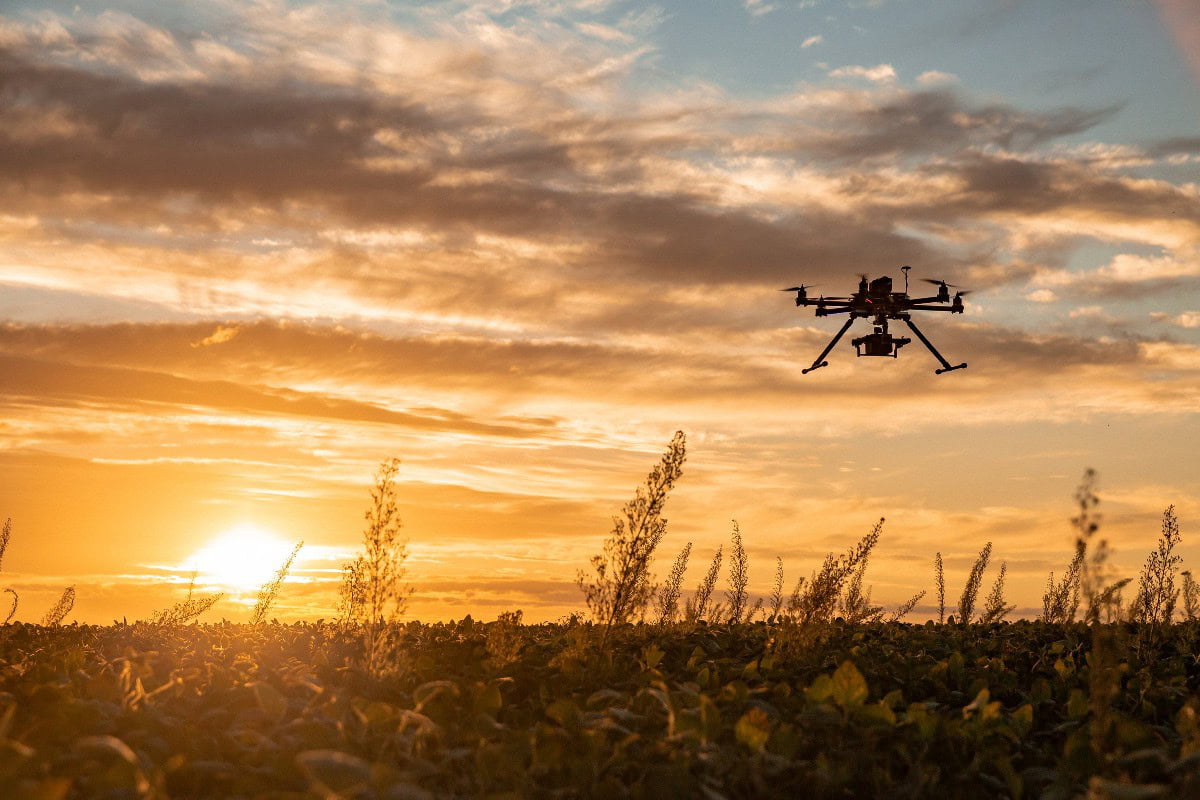
Crop sensing can automate the process of physically checking the growth of crops to determine how much water is needed.
Irrigation scheduling has typically been limited to one point measurement in a paddock using a soil moisture sensor. There are two main problems with this approach, particularly for arable growers who often have multiple crops under one irrigation system:
- First, to gather more useful results a grower would require one soil moisture sensor per paddock, which gets expensive
- Second, soil moisture monitoring measures what’s readily available to the plant but doesn’t provide any forecasting.
The aim of the project was to use the SWAN Systems™ platform, an automated water balance model, alongside remote sensing data to calculate the crop coefficients throughout the irrigation season.
Soil water management can make a huge difference to the profitability and sustainability of a farm.
Crop coefficients
Crop coefficients are almost synonymous with the amount of canopy cover. The development of the canopy follows a predictable pattern, with cover growing as temperature increases over time until the canopy is closed, then decreasing as the crop matures (see Figure 1).
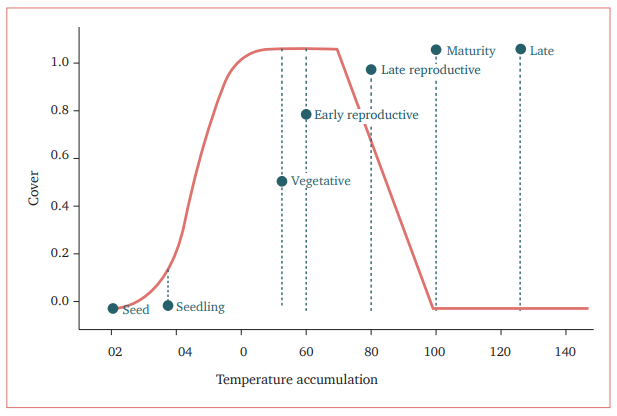
Crop coefficients can be derived for any crop if relevant temperature data are available, from the sowing date, harvest date and the stage at which the crop is established (seed or seedling) and harvested (vegetative, early reproductive, late reproductive, maturity or late).
“Essentially the satellite measures canopy cover and then that’s converted via various equations, which will tell you what stage the crop is at,” explains Cindy. “You can do some irrigation scheduling by working to the averages. Nine times out of 10 you’ll get it roughly right, but a lot of the arable farmers are looking to go beyond ‘roughly’.”
Methodology and results
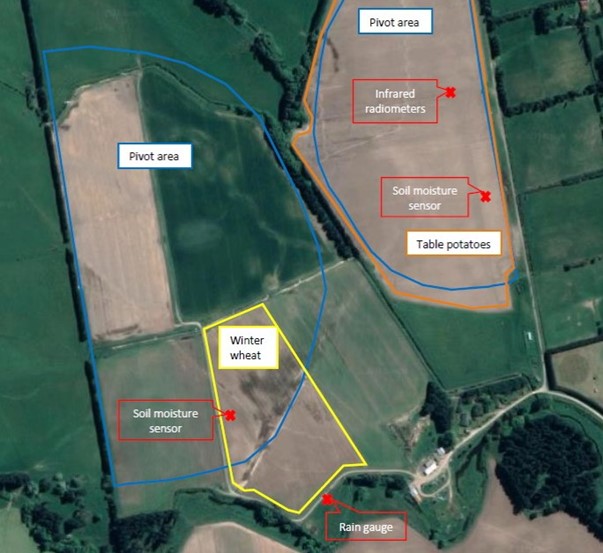
The trial was conducted on an organic vegetable farm at Hororata, Canterbury where the two crops (winter milling wheat and table potatoes) were studied.
An AquaCheck soil moisture sensor was installed that measured soil moisture and soil temperature at a 100, 200, 300, 400, 500 and 600 mm depth, along with a Davis rain gauge. All sensors were monitored using Halo Systems telemetry. Two SI-111 infrared radiometers were installed in the potato paddock to measure canopy cover. This data was recorded using a Campbell Scientific data-logger.
Satellite data were obtained through SWAN Systems™ via the Sentinel-2 and Planet satellites and DataFarming via the Planet satellite. Note that the Planet data only became available late in the season (from February 2021). The location of the sensors is shown in Figure 2.
While the sparse satellite data hampered the project, a reasonable model of crop cover was obtained. However, the approach is not commercially viable without being automated and integrated into a software platform. For example, the combination of the SWAN Systems™ water balance model, alongside weekly high-resolution satellite data, has the potential to provide farmers and growers with more accurate irrigation scheduling information.
Next steps
High-resolution (0.8 m) satellite data will be available daily via Planet for the 2021–22 irrigation season, and it will be possible to continue refining the crop coefficient calculations. Water Strategies intends to investigate the potential to extend this research project given the improved data availability.
SWAN Systems™ are currently working on an update to automatically calculate crop coefficients from remote sensing data, which should be available for the 2021–22 irrigation season. Testing this update in New Zealand conditions and further refining the integration of NDVI data would be useful.
Cindy says the trial was a success, despite the limited satellite data available during the growing season, because when reliable data came on-stream in February it showed what was possible. Now she would like access to research done on crop coefficients in New Zealand to help streamline the model.
“The next stage is getting all the crop growth stage data that’s filed in various people’s filing cabinets at government institutions out and into something useful. They’ve done a lot of crop coefficient work already so we can interpret some of that data. The technology’s definitely coming and hopefully in five or so years it will be viable in New Zealand,” she says.
– Tony Benny for Our Land and Water National Science Challenge
More information:
- Rural Professionals Fund 2020-21
- Download PDF
- All text in this article is licensed for re-use under Creative Commons Attribution 4.0 International (CC BY 4.0)
Author
Leave a Reply