 View Our Strategy Document 2019 – 2024
August 30, 2024

How Northland Regional Council is Using Physiographic Science
Since 2019, physiographic science developed by the Physiographic Environments of New Zealand programme has been helping Northland Regional Council build better maps, models, and monitoring networks.
Physiographic information has helped scientists at Northland Regional Council deepen their understanding of the most important drivers of water quality variation in their region.
The physiographic approach, developed by the Our Land and Water Physiographic Environments of New Zealand programme, is contributing to council work that, ultimately, will help the region’s land stewards identify the most effective mitigation actions for their land, and inform council remediation work in environmental hotspots with high recreational value, such as the Kaipara and Hokianga Harbours.
For example, a 2020 catchment study for Hokianga Harbour used physiographic layers to assess the contaminant load for the Hokianga Harbour and develop risk maps to help inform the priority catchment areas to mitigate land-use impacts.
“In future we’ll be able to use the refined [physiographic] model at farm scale to identify the right mitigations in the right places for better water quality outcomes.”
— Manas Chakraborty, freshwater scientist. Northland Regional Council
‘Physiographic’ zones are landscapes with similar attributes that influence water quality, such as climate, topography, geology and soil type. Using a physiographic classification helps us better understand how contaminants move through the landscape.
Ten physiographic environment classifications and underlying driver layers were developed by the Physiographic Environments of New Zealand programme (PENZ), led by Dr Lisa Pearson and Dr Clint Rissmann of Land & Water Science.
Manas Chakraborty, freshwater scientist at Northland Regional Council, describes the physiographic maps as a useful “cheat sheet” that creates clarity on how the region’s landscape attributes contribute to water quality. In particular, the approach has helped council scientists understand the hydrology pathways taken by contaminants, and the oxidation-reduction (‘redox’) processes in the underlying soil and geology.
“For example, the maps explain why the region has very few waterways that are high in nitrate,” says Mr Chakraborty. “Two-thirds of the catchments in our region are classified as ‘reducing’ environments. That’s why Northland looks good for nitrate toxicity in our waterways – but the organic and ammoniacal forms of nitrogen are relatively high, and this can be oxidised instream while moving downstream further towards the estuary.”
Combined-mapping approach
Northland Regional Council has been making use of physiographic science since 2019, often in combination with additional high-resolution radiometric data from a 2011 mineral exploration survey in the region.
This combined-mapping approach contributed to the council’s ‘wetness gradient layer’, which is helping identify saturated land and delineate wetlands across the region, and to an erosion susceptibility risk assessment, which is helping prioritise afforestation in erosion-prone areas.
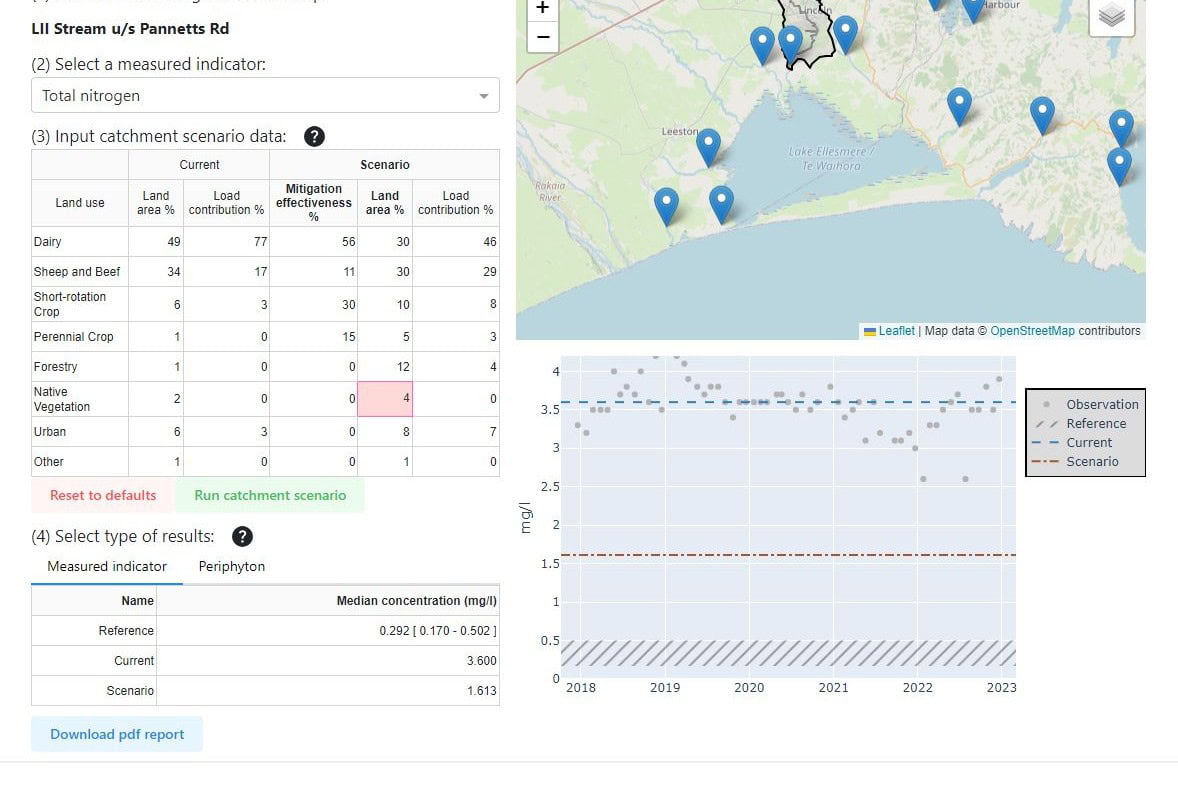
Physiographic attribute gradients, in combination with the high-resolution data and detailed water quality information, were used to develop a water quality attribute prediction model for the region in 2020, to help the Northland Regional Council understand its obligations under the National Policy Statement for Freshwater.
As part of that work, the council used its predictive modelling algorithms to show the combination of physiographic layers driving water quality, says Mr Chakraborty. “For example, high E.coli could be explained by high run-off risk and artificial drainage on highly erodible land with intensive land use.”
“That in-depth understanding we now have comes from the physiographic model. Even if it didn’t give, at reach scale, the exact values that match observed values, it still helped us understand what is actually happening in terms of water quality process. In future we’ll be able to use the refined model at farm scale to identify the right mitigations in the right places for better water quality outcomes.”
In 2021, the council reviewed its water quality monitoring network and used physiographic process maps to identify where additional monitoring sites were required.
Northland Regional Council scientists realised much of the uncertainty in the model came from unmonitored headwaters in bigger catchments. To enhance the predictive model, in 2021, the council reviewed its water quality monitoring network and used physiographic process maps to identify where additional monitoring sites were required.
“We tested our river monitoring network to see if it represented the physiographic variation across the region,” says Mr Chakraborty. “This told us that introducing a few additional long-term monitoring sites would give us useful information, and indicated a need for testing some new attributes, such as dissolved organic carbon.”
The physiographic approach in other regions
Due to the high level of stakeholder collaboration mandated by the National Science Challenges, Our Land and Water was uniquely suited to support this research. Seven regional councils collaborated in the PENZ research project and are now applying PENZ-developed science across New Zealand.
The approach is being utilised by organisations in Southland (Thriving Southland, Great South, Southland District Council), on the West Coast (Department of Conservation), Bay of Plenty (Bay of Plenty Regional Council), and in Canterbury (Living Water).
The PENZ team has almost completed an SFFF-funded web-based tool for farmers, LandscapeDNA, to help farmers identify the inherent risk of contaminant loss, better optimise their land management, and identify which mitigation measures are most likely to be effective.
This article was prepared as an impact case study for MBIE as part of Our Land and Water's 2020–21 annual reporting requirement.
More information:
- Physiographic Environments of New Zealand research
- Physiographic Controls over Water Quality State for the Northland Region (report for Northland Regional Council, January 2021)
- Application of physiographic based modelling to estimate contaminant load to the Hokianga Harbour (report for Northland Regional Council, January 2021)
- LandscapeDNA
Author

Leave a Reply