 View Our Strategy Document 2019 – 2024

August 30, 2024


Paul Sutherland
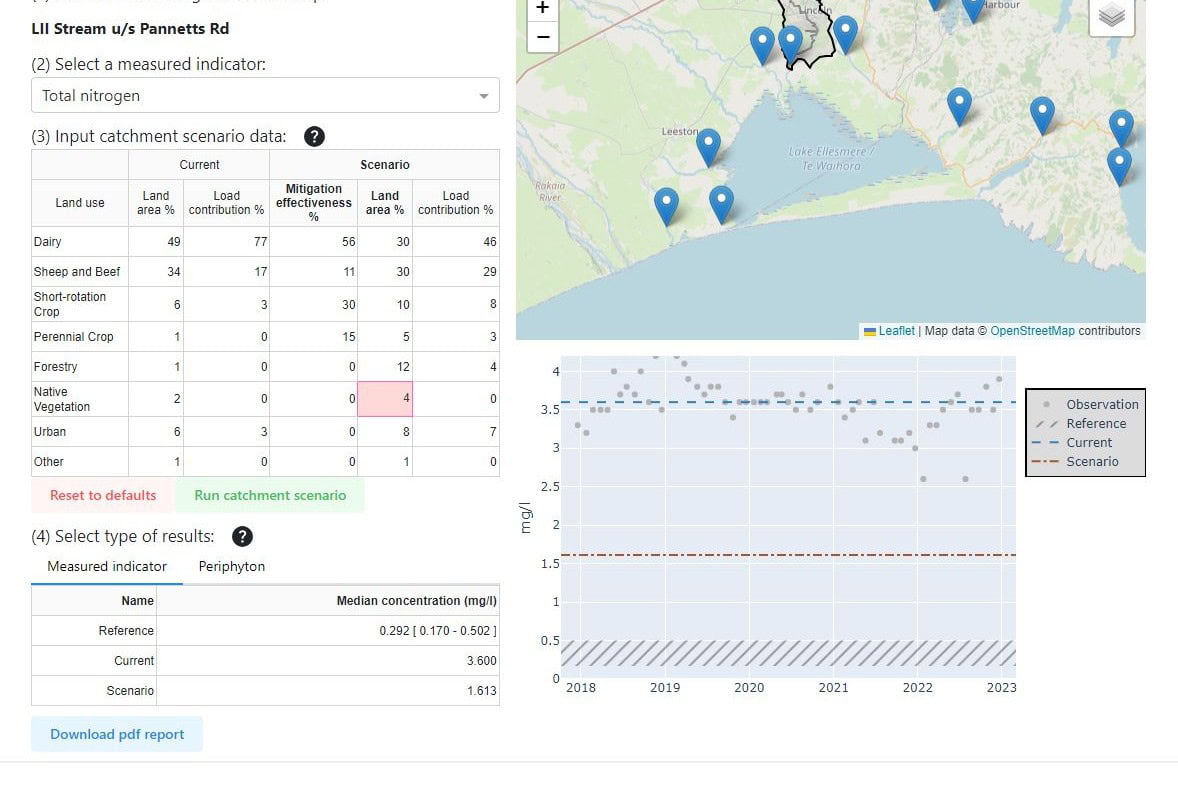
Map of Total Nitrogen Excess and Reduction Potential
An interactive map shows the total nitrogen (TN) in excess of current national rules and the potential for mitigation strategies to reduce TN losses from land to water by 2035. The map allows users to zoom in to any of New Zealand’s catchments or regions, and swipe between two views. Swiping to the left reveals the total nitrogen load in excess of current regulatory objectives. Swiping to the right reveals the potential for on-farm actions to reduce nitrogen loss from land to water. This allows New Zealanders to see which rivers, lakes and estuaries are under the most pressure from agriculture, and whether all farmers adopting all on-farm mitigation actions will ease this pressure by 2035.
Source: Snelder, T. H., Whitehead, A. L., Fraser, C., Larned, S. T. & Schallenberg, M. (2020) Nitrogen loads to New Zealand aquatic receiving environments: comparison with regulatory criteria. N. Z. J. Mar. Freshwat. Res. 54, 527-550. https://doi.org/10.1080/00288330.2020.1758168
McDowell, R. W., Monaghan R.M., Smith, C., Manderson, A., Basher, L., Burger, D.F., Laurenson, S., Pletnyakov, P., Spiekermann, R., Depree, C. (2021). Quantifying contaminant losses to water from pastoral land uses in New Zealand III. What could be achieved by 2035? N. Z. J. Agric. Res., 1-21 (2021). https://doi.org/10.1080/00288233.2020.1844763
McDowell, R. W., Pletnyakov, P., Lim, A. & Salmon, G. (2020) Implications of water quality policy on land use: a case study of the approach in New Zealand. Mar Freshw Sci. https://doi.org/10.1071/MF20201