 View Our Strategy Document 2019 – 2024
August 30, 2024
Sensors Increase Understanding and Interest
Real-time nitrate sensors increased farmer understanding of contaminant pathways through their farm and the impact of rainfall events, and grew community interest in water quality improvement.
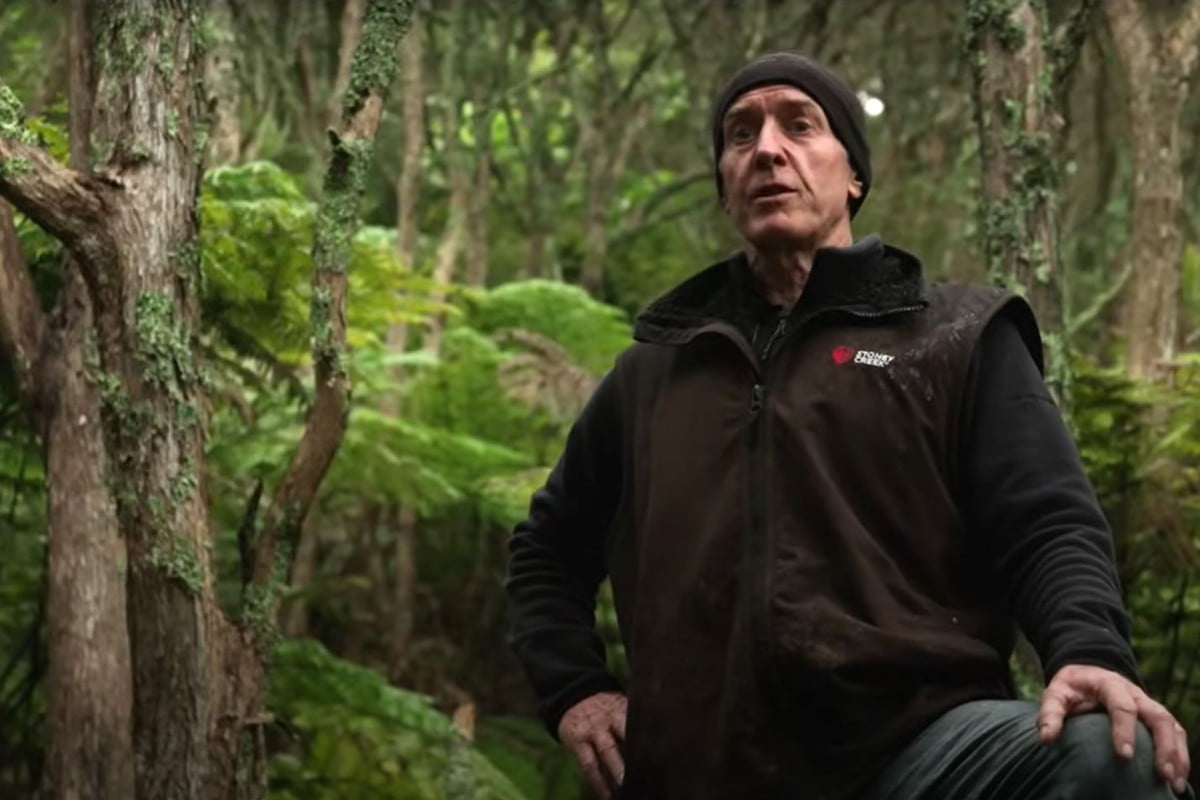
John and Sarah Wright’s farm is in one of the most beautiful areas in the country. And despite being close to the wilderness areas of the Southern Alps and the beautiful mountain lakes, water quality is a problem in their wider catchment.
The Opihi River has its origins in the Sherwood and Ben McLeod Mountain ranges and wends its way through the patchwork of farms and forestry. At the town of Fairlie it swings gently with its arm cradling John and Sarah’s farm, Wainono Dairy, before it plunges through the Opihi Gorge.
The farm sits at the southern end of the Fairlie Basin, which has been identified as a High Nitrogen Concentration Zone by Environment Canterbury, with reductions in N leaching losses from farmland required to reduce nitrate concentrations in groundwater. Groundwater running under the farm comes from within the basin and empties into the gorge. This means John and Sarah’s operation isn’t solely responsible for all the nitrates in this water.
John has been testing the water quality on the farm quarterly for nearly 10 years, taking water samples every three months and sending them off for testing. Despite having lots of data, he knew that wouldn’t catch the immediate after-effects on nitrate levels from sudden weather events or irrigation using this infrequent method.
With tighter regulations around nitrates and groundwater more likely in future, John wanted to create a robust set of baseline data now, to make it easier to supply the kind of data that will be needed for compliance purposes later.
“If there are any issues identified coming from the Upper Opihi, John doesn’t want the finger getting pointed at him,” says agricultural consultant Charlotte Senior. “Data from this project will help understand the farm’s impact on the catchment and whether efforts to improve freshwater are on the right track.”
When Charlotte first posed the idea of real-time sensors at a catchment meeting about 10 farmers put their hands up to trial them. “There’s a lot of interest,” she says.
Charlotte and John applied for funding through the Our Land and Water National Science Challenge Rural Professional Fund. The project ran from October 2021 for a year.
Setting up the sensors
Because the farm has a shallow impervious layer of mudstone lying beneath the surface, water does not drain from the upper unconfined aquifer. Rather, it flows quickly over the top of the pan and under the topsoil.
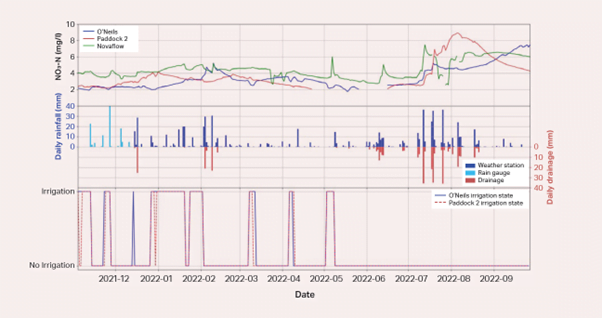
Three HydroMetrics GW50PC nitrate sensors developed by Hydrometrics, a division of Lincoln Agritech, were installed along the direction of groundwater flow. One at the top of the farm – marked O’Neils – was in a pumped gallery and an indicator of what was going on in the catchment above the farm.
The Novaflow sensor was at the bottom of the farm in a Novaflow pipe where water exited just before the Opihi Gorge. The sensors would measure nitrate-N concentrations hourly, with data uploaded to a data portal hosted by Hydrometrics.
Once it was all up and running, they found it took about two days for N spikes caught by the sensors at the top of the farm to show up at the bottom end. The two sensors were leased for the project while John bought another one – not a small undertaking at nearly $10,000 each.
John’s sensor – Paddock 2 – was also a deeper sensor in a pumped gallery just above the mudstone in the middle of the farm, on the theoretical flow path between the top and bottom sensors. But it seemed to pick up other N sources periodically, and may have had a more localised response influenced by a cropping paddock close by that was growing kale during the project.
Although the kale crop represented only 6% of the total farm area, OverseerFM modelling estimated it was responsible for 12% of the farm’s total N losses. The fodderbeet crop, on the other hand, had negligible N loss. Fodderbeet has lower crude protein concentrations, reducing dietary and urine N concentrations, points out Charlotte.
Results
“It was clear drainage from big rainfall events was the main driver behind nitrogen losses,” says Charlotte, “with the nitrogen originating from urine patches.”
N fertiliser inputs were relatively low for a Canterbury dairy farm. In the 2021-2022 season, an average of 144 kg N/ha/yr was applied on paddocks.
“John has good fertiliser management practices,” Charlotte says, “putting it on little and often, not applying when the soil moisture is high, and ensuring soil temperature is high enough to be sure of plant uptake. We couldn’t see those fertiliser applications in the data.” This would be expected because fertliser is taken up by pasture, eaten by cattle, and the N leached
from urine patches that have an N excess.
daily rainfall (mm) and irrigation events (on/off)
Generally, the Novaflow bottom sensor saw sharp increases in N concentrations following significant rainfall events. The sensor was close to the surface and quickly picking up changes and increases to drainage and shallow groundwater. As might be expected, given the different type of installation, this saw the site with the highest average monthly N concentrations for most months.
Mid-July saw the first big rain event since the project started with a 36 mm downpour. The Novaflow sensor had the first response, while the upper site and middle site were delayed by five and nine hours, respectively (Figure 1).
After the three biggest big downpours during the project, which all happened in July, the impacts of the catchment above the farm draining through it were clear. The O’Neil sensor at the top of the farm continues to show rising nitrate levels, while the middle site seems to have peaked and is on the decline. The Novaflow is still elevated.
“As John has been transparent about his data, the community response and from other farmers has been very good,” Charlotte says, “We have observed a high level of interest in the health of the waterways.
“It’s been good for them to be able to see the results of rain events,” she says. “We had a wet summer and it was clear from the data – it gave people confidence in what they were seeing.”
Since the project got underway, Opuha Water, the farmer co-operative operating the irrigation scheme, has started doing free water testing for nitrates for local farmers in the area. The catchment has high irrigation use and this will give the co-operative a better understanding of what is happening there.
With the project at an end, Charlotte is looking at keeping all the sensors operating for a time. “The data is too good to waste,” she says. “It has also revitalised interest in the catchment for the people who live there.”
A community-driven water quality monitoring and management programme would be a powerful tool to improve the reach of monitoring programmes, concludes the project’s report. Despite strong collaboration among the host farmers, scientists, rural professionals, the irrigation scheme and local catchment groups, there is only so much good one farmer can do alone. Leveraging these networks to conduct large-scale water quality monitoring across the catchment could open a huge opportunity for learning.
Improving water quality outcomes through real-time water quality monitoring
Why: To use real-time water quality monitoring to show the impact farm management can have on freshwater quality.
Where: Dairy farm bordering Opihi River near Fairlie, Canterbury.
Who: Charlotte Senior (The AgriBusiness Group), John and Sarah Wright (dairy farmers), Nicole Holliday (Ballance Agri-Nutrients) and Dr Blair Miller (Lincoln Agritech).
What:
- Three HydroMetrics GW50PC nitrate sensors installed on a Fairlie farm showed real-time nitrate levels in groundwater as it passed through the farm, capturing nitrate spikes.
- Real-time sensors require an initial investment, but provide rich and consistent data (8,760 hourly readings p.a.).
- The likelihood of nitrogen (N) spikes is dependent on rainfall events. The higher N concentrations over winter surprised the farmer, highlighting that other farmers may learn from this.
- The upper and lower sites were correlated, and demonstrated that N concentrations in groundwater flow could be detected coming from the top to the bottom of the farm.
- There are increasing variations in climate from season-to-season, making it difficult to determine ‘typical’ results.
Read more: Real-time water quality monitoring: Improving water quality outcomes through real-time quality monitoring – final report, November 2022
Author
Leave a Reply