 View Our Strategy Document 2019 – 2024

August 30, 2024
New Rules Reduce Nitrogen on Dairy Farms
A recently completed study shows nitrogen leaching has reduced on South Island dairy farms since a new 190 kg/ha/ year limit on nitrogen fertiliser application was introduced.
Dairy farmers have reduced their use of nitrogen (N) fertiliser in line with the recently imposed 190 kg/ha/year limit, a recently completed study shows. While that has reduced the amount of N in the farm system, there are still large amounts of N inputs being added to farm systems in the form of supplementary feed and from fixation by clovers.
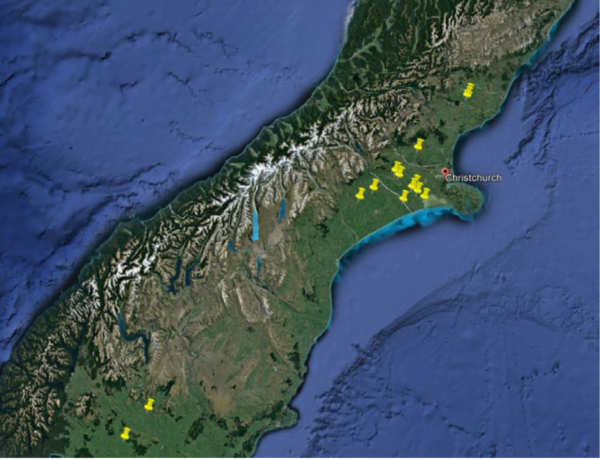
The project analysed 12 irrigated Canterbury farms and three Southland dairy farms (Map 1), comparing their OverseerFM files from 2020 and 2023, as well as interviewing the farmers about how they had managed changes.
The project was the brainchild of agricultural economist Phil Journeaux and follows on from research he did when the 190 kg restriction was first announced.
“I did some work then trying to analyse what the issue was, which really came down to the top quartile of dairy farms and irrigated dairy farms in terms of nitrogen usage,” Journeaux recalls.
“At that stage farmers potentially could compensate for the reduction in nitrogen fertiliser by other sources, particularly by buying in supplementary feed, so I was interested to follow that up to just see exactly what they had done and what the outcomes had been.”
Journeaux worked with Charlotte Glass and Chris Beatson of Agri Magic Ltd, with funding from Our Land and Water’s Rural Professional Fund.
The team found 15 farmers willing to share their OverseerFM records and farm accounts and talk about the changes they’d made since the limit came in.
The team found 15 farmers willing to share their OverseerFM records and farm accounts and talk about the changes they’d made since the limit came in.
The results were in line with their expectations, although Journeaux says he’s cautious to read too much into the findings, given most of the farms surveyed were in Canterbury (only three Southland farms were included).
“We found all the farmers had reduced their nitrogen fertiliser application below the 190 kg level, some of them substantially. But virtually all of them had increased the amount of nitrogen going into the farm via supplementary feed or increased cropping, and the amount of nitrogen being fixed by clover had also increased,” he says.
Overall, there was a substantial reduction in the amount of N being leached from pastures.
Impact of nitrogen fertiliser restriction
Why: To investigate how farmers had responded to the regulatory capping of synthetic nitrogen (N) fertiliser at a maximum of 190 kg/ha/year onto pastoral farms, and the impact this had on N leaching and greenhouse gas (GHG) emissions.
Where: Twelve irrigated Canterbury and three Southland dairy farms.
Who: Phil Journeaux (Journeaux Economics), and Charlotte Glass and Chris Beatson (AgriMagic).
What:
- The restriction on synthetic N fertiliser application led farms to reduce applications (in most cases) to well below the 190 kg/ha/ year limit.
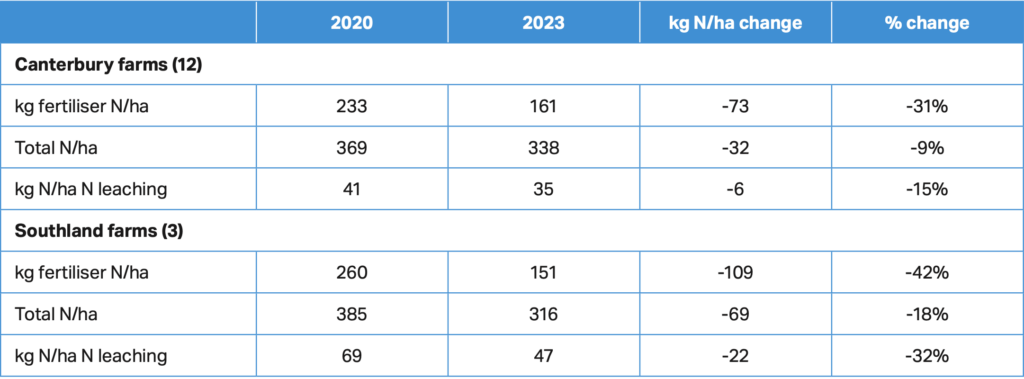
- Overall, application of N fertiliser on the Canterbury farms reduced 30% on average (range −3% to −46%) and on the Southland farms reduced 41% (range −23% to −51%).
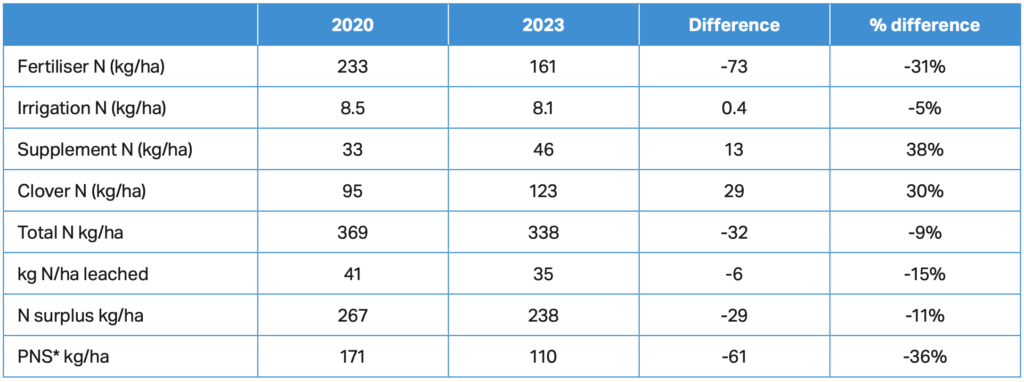
- The amount of total N input into the system reduced to a much lesser extent due to compensatory inputs: increased supplementary feeds, cropping and N fixation by clovers.
- Overall, total N within the system reduced 9% on average for the Canterbury farms and 18% for the Southland farms.
- The key effect was that N leaching decreased on average by 15% in Canterbury and 32%
in Southland. - Gross GHG emissions reduced 1% in Canterbury and 9% in Southland.
Canterbury and Southland comparisons
Overall, the application of N fertiliser on the Canterbury farms has fallen 30% on average (range −3% to −46%) and 41% (range −23% to −51%) for the Southland farms. N leaching decreased on average by 15% in Canterbury and 32% in Southland (Tables 1 and 2).
The differences between Canterbury and Southland are mainly down to the different ways of farming, as well as different climates and different soils. Most Canterbury dairy farms are irrigated and most in Southland are not. However, too little information was available to say if the differences were statistically significant.
Supplementary feed replacing nitrogen
Nitrogen is an essential part of the dairy industry in New Zealand, vital to keep pasture growing to achieve the production needed to make farming profitable, and Journeaux says it is effectively the cheapest form of supplementary feed.
“So, if you’re not growing as much feed via using nitrogen fertiliser, then the next step up the ladder is to buy in supplementary feed, that’s just a bit more expensive than nitrogen fertiliser. In a simplistic sense, that’s exactly what happened,” he says.
The farms in the trial were all applying more N fertiliser than 190 kg/ha/year before the rules changed, with Canterbury having a mean of 222 kg, much higher than anywhere else in New Zealand. Southland was also well up on the national mean at 185 kg.
“The top quartile in Canterbury were using over 300 kg per hectare,” Journeaux says, adding that farmers had to adapt to achieve the production they needed.
“We interviewed them all as part of the programme and they had accepted the regulation, so they had to work out, ‘I’ve got to reduce my nitrogen fertiliser, how do I adjust my farm system to make sure it continues to be profitable?’”
Overall, total N within the farms studied was reduced by 9% on average for the 12 Canterbury farms and 17% for the
3 Southland farms.
If the amount of forage available on-farm is reduced as a result of a limit on N fertiliser, then often the next best option (in an economic sense) is to use supplementary feed to “plug the gap”, the report states.
Whether or not to use supplement is essentially a marginal cost versus marginal benefit calculation. The use of supplementary feed could mean that the total amount of N cycling through the farm is maintained and there is no reduction in nitrate leaching.
However, despite N coming onto the farm in sources other than artificial fertiliser, OverseerFM modelling confirmed that there was less total N in the system (9% less on average in the Canterbury farms and 18% less in the Southland farms) and N leaching has decreased significantly.
Total nitrogen was reduced
Overall, total N within the farms studied was reduced by 8% on average for the Canterbury farms and 17% for the Southland farms.
The research concluded that the total N input into the farms in the study reduced thanks to the new limits. However, the effect was limited due to ‘compensatory’ inputs in the form of increased supplementary feeds and increased cropping, and in particular an increase in N fixation by clovers.
“While limiting the use of nitrogen fertiliser has clearly reduced the amount of nitrogen in farm systems, that’s only part of the picture,” Journeaux says.
“It’s the total amount of nitrogen in the system that’s important, not just nitrogen fertiliser. There are other things like nitrogen in your supplementary feed and the nitrogen being fixed by clover that are pretty hard to regulate.”
The main source of N is from cow urine. Nitrogen fertiliser increases pasture growth, which is eaten by animals, with the excess N then excreted as urine, from which the nitrate then leaches.
Another source of N is cropping. Nitrogen released from the bottom of the root zone via mineralisation at the end of a crop is difficult to manage, depends on the weather, and risks increasing N loss if farmers increase their area of forage crop.
“Nitrogen leaching is the same, whatever the source – nitrogen’s nitrogen,” he says. “You can restrict nitrogen fertiliser but it’s the total amount of nitrogen in the system which is the important thing.
“What our report shows is that the total amount of nitrogen has actually decreased, mainly as a result of the reduction in the use of fertiliser nitrogen.”
Surprising results
“The reduction in nitrate leaching was greater than I would have anticipated,” says Journeaux. “I hadn’t anticipated farmers would have reduced their nitrogen fertiliser so much.
“The case study farmers we picked were all using more than 190 kg of nitrogen prior to the regulations. That was quite an important stipulation, because we wanted to measure what they were using then versus what they’re using now.”
Interviews with farmers showed there was some surprise that N fertiliser applications had dropped as low as they had. There were also concerns that if the restriction was tightened further, then it would directly affect the profitability of their business.
The researchers suggest the higher-than-expected reductions were due to a combination of farmers coming to grips with the new regulatory regime and looking to ‘fine-tune’ their systems, as well as coping with climatic conditions.
Journeaux believes that reducing N in dairy farm systems is more complicated than simply limiting the application of N fertiliser. “While I think the result is somewhat serendipitous, overall nitrogen leaching has reduced, which is a key objective.”
Financial implications
With pressure on to keep production up, it did not surprise Journeaux that farmers turned to supplementary feed to achieve that. He says farmers had to adjust their systems accordingly, which sometimes led to greater efficiency.
Farm accounts were analysed to see if changes in farm profitability can be linked to changed fertiliser rules, comparing the 2019/20 accounts to the 2022/23 accounts. The hypothesis was that costs would have increased as supplementary feed took the place of N fertiliser.
However, it was difficult to assess the financial implications of the restriction on synthetic N fertiliser usage, given the significant inflation of on-farm costs (27%) over the period. Expenditure on feed as a substitute for N fertiliser did rise significantly, both in nominal and real terms.
“I would say for some farmers who were putting on excessive nitrogen fertiliser to start with, the regulations forced them become more efficient,” he says. “Nitrogen fertiliser is an important input onto farms, but you have to use it very efficiently in terms of getting the best in monetary terms and having the least impact environmentally.
“Farmers need to think through the implication of that. If they’re putting on excessive amounts, if they go from 300 kg to 190 kg, there’s probably no implication for their system other than saving a heap of money.”
GHG implications
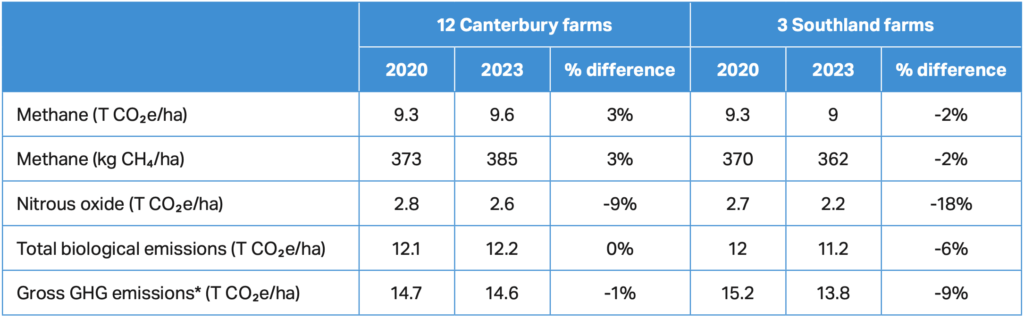
The researchers also investigated the impact of the reduction of N fertiliser on greenhouse gas (GHG) emissions, reporting that the results are “somewhat mixed” (Table 3).
For the Canterbury farms, methane emissions increased by 3% due to the increase in supplementary feed but dropped 2% for the three Southland farms. Nitrous oxide emissions were down for the farms in both regions; Canterbury by 9% and Southland by 18%. Total biological emissions were static for the Canterbury farms but dropped 6% in the Southland farms.
This article was first published in New Ground magazine, issue 4. All text is licensed for re-use under Creative Commons Attribution 4.0 International (CC BY 4.0)
Author

Leave a Reply