 View Our Strategy Document 2019 – 2024

August 30, 2024
How Aotearoa New Zealand Might Transition to More Mosaics of Land Use
In the literature, mosaics are land-use options often cited for their ability to help farmers overcome environmental challenges by increasing resilience and biodiversity. They offer an alternative to the monocultures that tend to exist at farm scale in Aotearoa New Zealand.
To understand what mosaics are and how different mosaics could be applied to deliver land-use change that maximises profit and minimises nitrogen (N) and phosphorus (P), new Our Land and Water research combines modelling with stakeholder interviews to investigate the implications of transitioning to more diverse mosaics of land use.
What are mosaics of land use?
A challenging issue is to define exactly what is meant by mosaics of land use.
“What we discovered is there is no one clear definition of a ‘mosaic' of land use. Different groups have their own unique understanding of what it means,” says co-lead researcher on the project, Reina Tamepo.
This means that determining land use needs to be driven by what the community or the catchment most wants to achieve.
Broadly, mosaics of land use are often considered an answer for increasing resilience or biodiversity. Yet if land users want to achieve environmental outcomes, the research shows it’s more important to work with systems that specifically deliver these requirements.
To give more clarity around the meanings and benefits of mosaics, the researchers brought together stakeholders to give feedback on what they considered mosaics to be and what the benefits were for their catchment.From this feedback, three measures of mosaics were derived. These were:
- Patch Richness (PR) is the number of classes
- Total Core Area (TCA) is the area of patches that are not at the edge of the patch
- Patch Density (PD) equals the number of patches in the landscape, divided by total landscape area
Two new models for land and water interactions
As part of the project, the team also developed two new models and applied those across two case study catchments, one in the Ruamahanga catchment in Greater Wellington and one on the Canterbury Plains.
The National Water, Environment and Economic Land Use Models address three elements: water use, water quality parameters and profitability of land uses.
“These two models are available for investigations of land and water interactions at the regional and national scale,” says Simon Harris, managing director for Land, Water, People (LWP) and co-lead researcher on the project.
By forcing land uses to occur as monocultures at three different scales – SDU (smaller scale), Farm and REC2 subcatchment – the model can show varying complexity in the patterns of land use. This complexity is known as “mosaic units”.
Investigating profitability and nitrogen loss in Ruamahanga
In the Ruamāhanga catchment in Greater Wellington, two approaches were taken. One approach modelled maximising profitability, while the other focused on maximising nitrogen loss reduction. The modelling results were averaged across 15 repetitions of land use placement.
The figure below depicts the different land uses across the catchment. While the proportions are very similar for each mosaic, the proportions for dairy, sheep and beef, arable and exotic forestry are slightly higher for the smaller scale (SDU) mosaic units, compared to the Farm and REC2 subcatchment units.
Meanwhile, for the Farm and REC2 subcatchment mosaic units, native vegetation and sheep & beef are allocated in larger proportions.
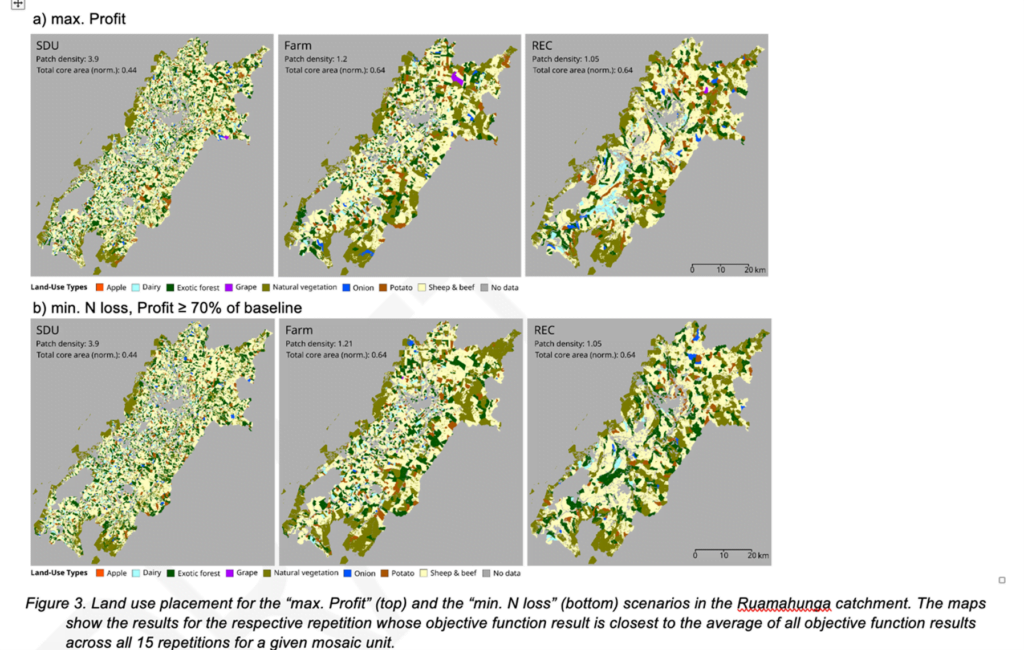
When it comes to maximising profit, land placement by the SDU mosaic units gives the highest total profit, followed by the Farm then REC2 mosaic units. The land uses in this scenario are dairy, arable and sheep and beef. Interestingly, these also show the three highest N and P losses.
For minimising nitrogen loss while still achieving 70% of the total catchment profit, land-use placement for the REC2 subcatchment mosaic units narrowly achieved the best result – a 37% reduction in N loss, with an 18% drop in total profit at a catchment scale.
Meanwhile land-use placement for the SDU mosaic units performed the worst for this primary objective, achieving only a 21% reduction in N loss with a 12% increase in profit compared with the baseline.
Modelling Canterbury land-use changes
In Canterbury, a different approach was used, where land uses were prioritised based on their profit. The figure below shows the highest value land uses placed in the most profitable locations until the constraint area of that land use was reached.
The constraint on each land use was set at its current area, apart from horticulture and vegetable growing, which were allowed to increase to three times their current area in order to give reasonable options for mosaics to occur.
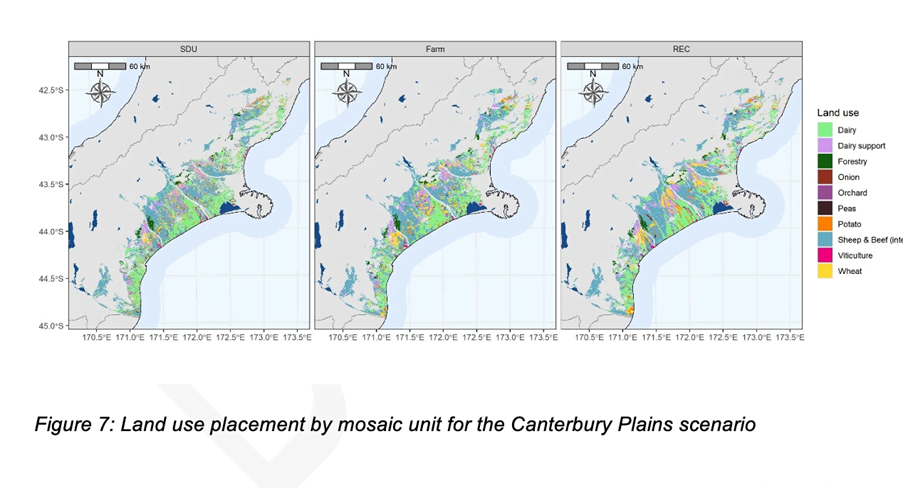
The modelling shows the expected outcome of land use placement by SDU mosaic units providing more diversity in Patch Density, followed by the Farm mosaic units and the REC2 mosaic units. This is because the SDU placements are in smaller blocks. Similarly, the Total Core Area indicator is lowest for land use placement by SDU mosaic units and highest for the REC2 mosaic units, indicating that the patch size distribution is most even for the SDU mosaic units.
Meanwhile when it comes to revenue and profit, the data shows that, at the regional level, there are only very minor differences between land-use placement options. SDU mosaic units are slightly higher than the other two, while the REC2 subcatchment mosaic units are the lowest. There is also very little difference between alternative land placement options for N and P losses.
Where to next?
This modelling provides a starting point to help Aotearoa New Zealand’s primary sector more clearly define what mosaics of land use are.
“The research concludes that when farmers are considering land use change, the choice of land use and area of change in a catchment is more important than exactly where change happens,” says Simon.
Future research should focus on developing a new version of the model that looks at both the catchment and farm scale, with a recommendation to include a large component of on farm research.
More information:
Author
Leave a Reply