 View Our Strategy Document 2019 – 2024

August 30, 2024


Pixabay, Pexels
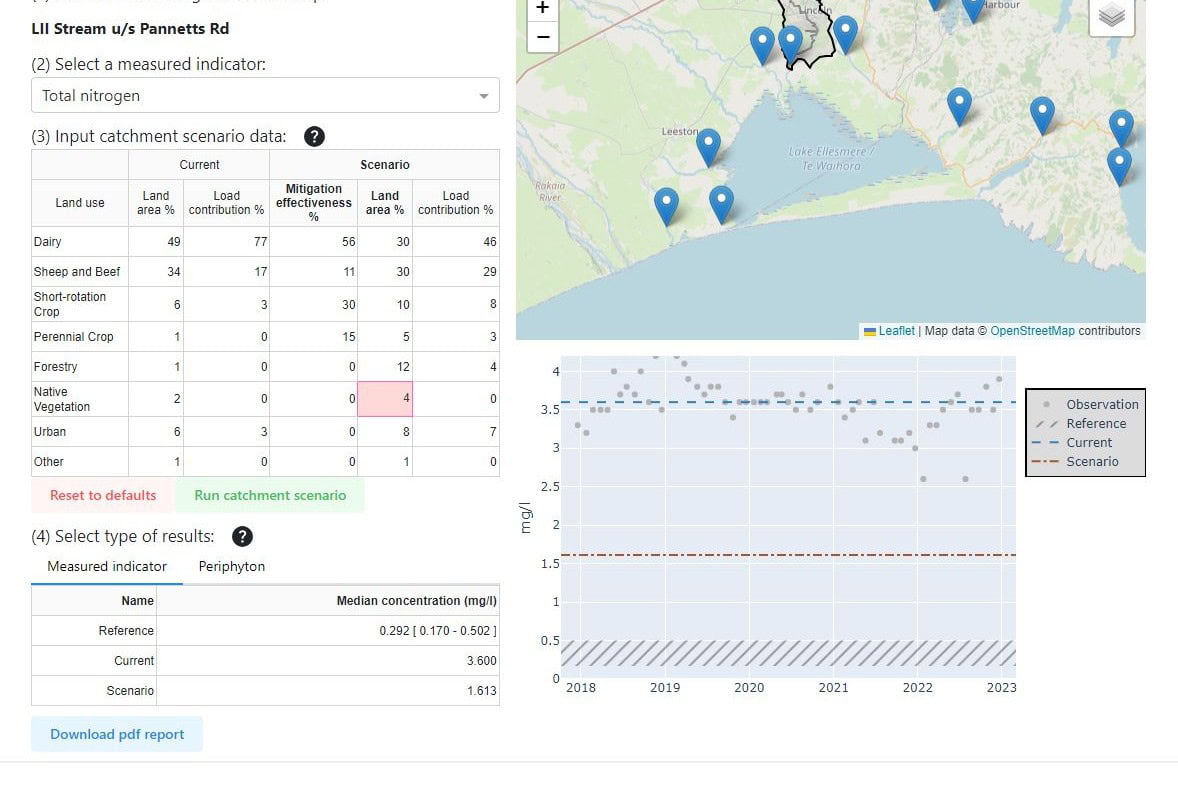
Tool for relating land use/management to sediment rating curve for the Manawatu catchment
July 2018
Visual clarity of water is the distance (in metres) through water that objects can be seen. It is variable over time because it depends on suspended sediment concentration (SSC) that varies with river flow. Therefore, the median visual clarity is often used to characterise visual clarity at a site. When sediment loads in rivers are reduced through erosion mitigation (see references), SSC in the river will also reduce and median visual clarity will increase.
To estimate increases in visual clarity due to reduced sediment load it is necessary to determine the relationship between visual clarity and SSC. Following Dymond et al. (2017), visual clarity (v) is related to SSC (s) by:
v = exp(d) sc
where d and c are constants at a given site on a river. To determine d and c, concurrent measurements of s and v are plotted in log-log space and a straight line fitted to the data. Figure 1 provides an example of this for the measurement site at Mangawhero at Raupiu Road. The gradient of the line is c and the intercept is d.
log(v) = d + c.log(s)
If the sediment load at a river site is reduced to a fraction (frac) of the baseline sediment load, then visual clarity will increase by the ratio??????????. For example, if c = –0.5 and sediment load reduces by 40% (i.e. frac = 0.6), then visual clarity will increase by the ratio 0.6-0.5= 1.3 (i.e. visual clarity will increase by 30%). Equation 2 was derived for different suspended sediment gauging sites and used to convert predictions of the effect of SLUI in
reducing sediment load to predictions of the impact on visual clarity.
Manaaki Whenua Landcare Research Contract Report LC3397
470 KB | Adobe Acrobat PDF File