 View Our Strategy Document 2019 – 2024
August 30, 2024
Oliver Weber
Project Summary – Future Risk Planning Through The Visualisation Of Forestry Harvesting Cycles
March 2024
The project team engaged an extensive audience through the project including iwi, councils, forestry industry, subject matter experts, scientists and public in order to deeply understand the pain points and common issues shared across the regions.
For the first time ever, forest stand locations and their age classes were classified using remote sensing techniques across 5 regions in New Zealand: Te Tauihu (Tasman District, Nelson City, Marlborough District), Te Matau-a-Māui (Hawkes Bay), and Tairāwhiti (Gisborne District) giving us an current, consistent and accurate picture of forestry at a landscape scale.
It created a consistent Catchment Management Unit data set and associated Hillslope Unit data set with calculations at the catchment level for all the infrastructure contained in the boundary of the catchment management unit to help create a simple and intuitive mechanism to interpret proportion of forestry and area of land within the ‘window of vulnerability’.
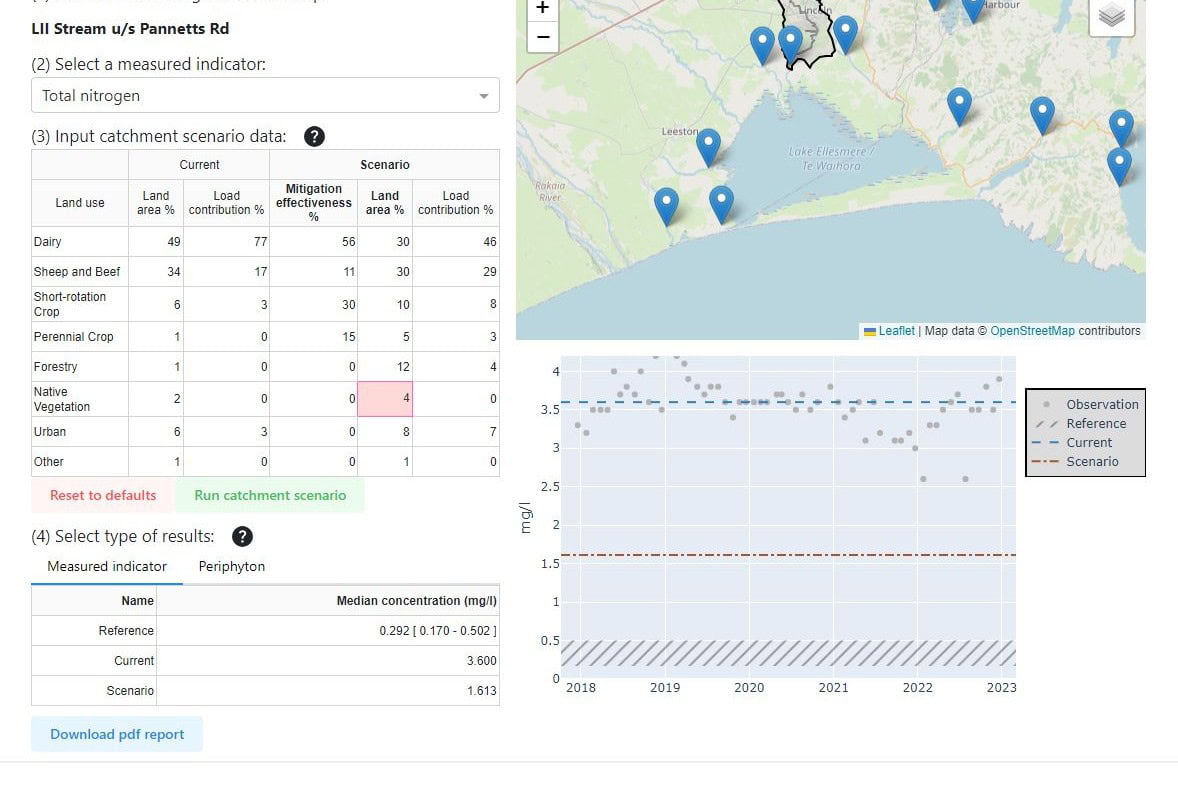
The Forest Catchment Planner app successfully visualised forestry data with a time slider to visualise anticipated forestry harvesting cycles over time and view infrastructure data and Māori land data in an intuitive and interactive format. The app unlocks additional value for users by removing obstacles around data sharing by providing simple tools for measuring areas, sharing data digitally and generating print maps.
2413 KB | Adobe Acrobat PDF File